Is anyone using NR7 for trading?

vagar11

Well-Known Member
#11
Wow, this is decent stats :D

But NR7 appearing across such a large spectrum of liquid, bluechip stocks, NR7 would be more of a sign of sideways / market consolidation.
Its apparent, as we are almost in the fag end of the year sandwiched b/w 3-4 key events with the Fed Hike still to come.

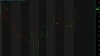
NR7 appears as symmetric triangles on charts, basically, a series of inside bars.
The other variants are the bullish and bearish triangles visually depicting support and resistance levels.
I am running the NR7 scanner on 172 F&o stocks. So, surely we will get 7-8 stock daily.
 
#12
i dont know what is your approach to nr7 is it stand alone system or some other thing is there. BUT nt7 and nr4 both of them are good stuff. for me if its happen with price structure and with supply demand analysis thn they give good trades.

regds,s
 

vagar11

Well-Known Member
#13
i dont know what is your approach to nr7 is it stand alone system or some other thing is there. BUT nt7 and nr4 both of them are good stuff. for me if its happen with price structure and with supply demand analysis thn they give good trades.

regds,s
Right now, I don;t have any approach. I have started this thread to gain some ideas if someone is using it.
 

doss186

Well-Known Member
#14
NR7 itself is not a strategy. It just indicates that the daily range is in contraction and there is chance for expansion of daily trading range in future. IMO the range expands approx after three trading days. It will not give any trading signal. use NR7 for stock screening only and use MACD and RSI based strategy for entry end exit.
 
Last edited:

vagar11

Well-Known Member
#15
NR7 itself is not a strategy. It just indicates that the daily range is in contraction and there is chance for expansion of daily trading range in future. IMO the range expands approx after three trading days. It will not give any trading signal. use NR7 for stock screening only and use MACD and RSI based strategy for entry end exit.
Thanks. But, I am allergic to indicators.

Thanks for this. "IMO the range expands approx after three trading days." This is worth looking into.

Care to show any stats or source for the same.
 

travi

Well-Known Member
#18
Seems weak, the logic of the inside bars is good, but I'm not able to buy 3 or 7 days etc.
Its the cyclic nature of an instrument, rise, fall & consolidate.

However, the short after NR7 (high win rate) also appears in various stats you pulled on Nifty gaps and likely trends. Just the nature of exhaustion.
That's just bcos bulls climb the stairs and bears jump out of the window :D
 

Similar threads