I hope your trading has been treating you well. I want to go into detail on my method of recently.
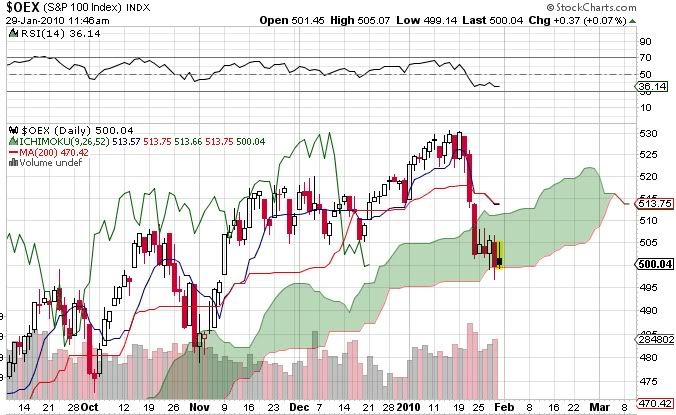
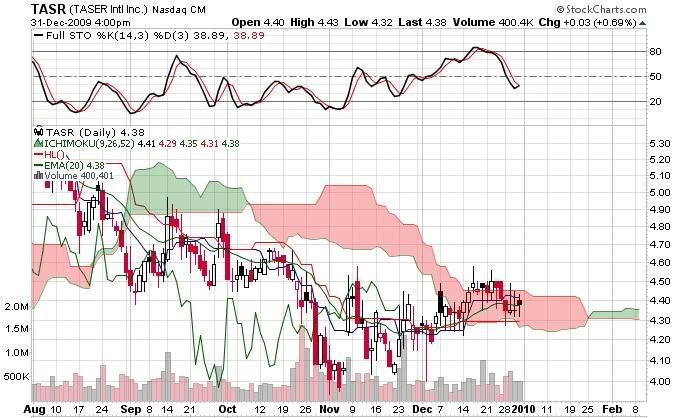
First, I look at the chart using the traditional 9,26,52 settings.
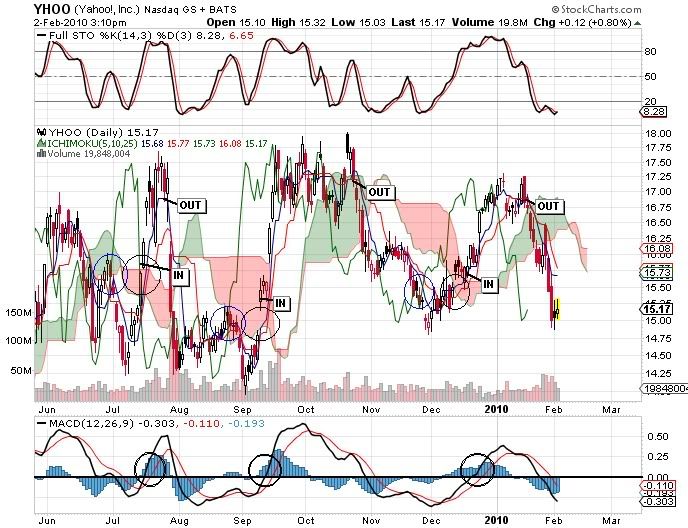
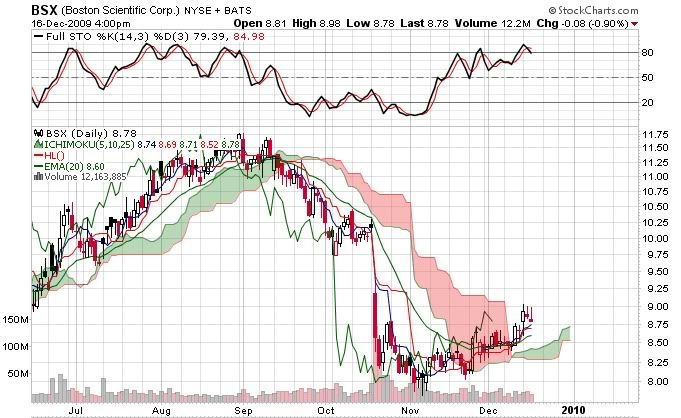
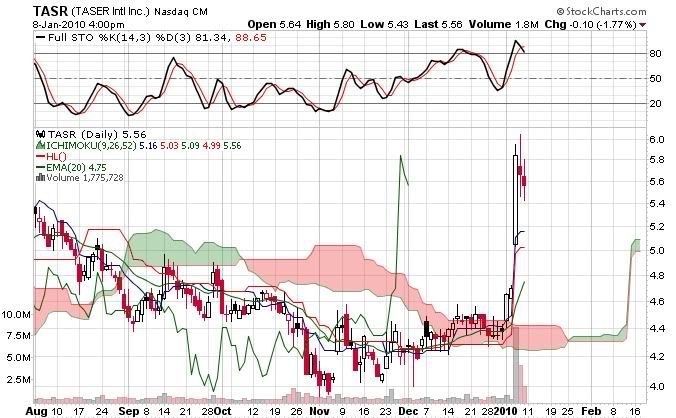
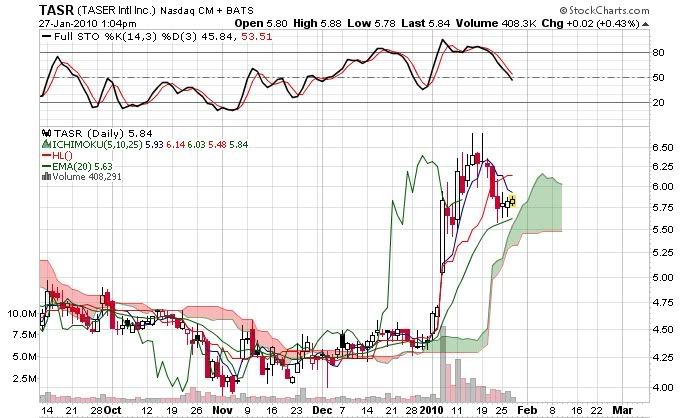
This setting alone may give me all the information I need but it may not. If price action is below the cloud and the cloud is not near the price then I may want to plug in shorter time frames for my settings. I like to use 5,10,25 for this application. You will notice that once you use these settings, the cloud is now closer to price which will give us more relevant information regarding short term price movement and sentiment.
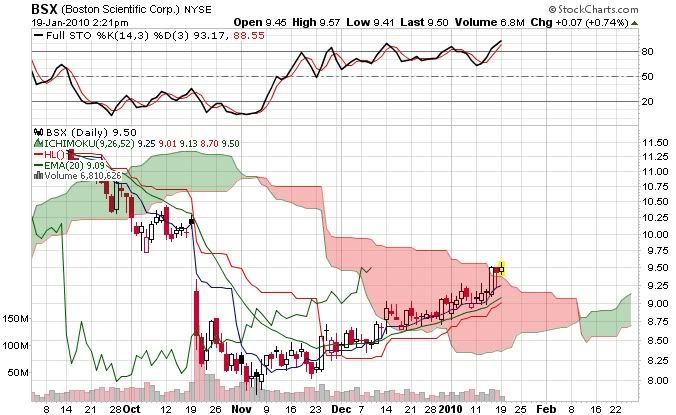
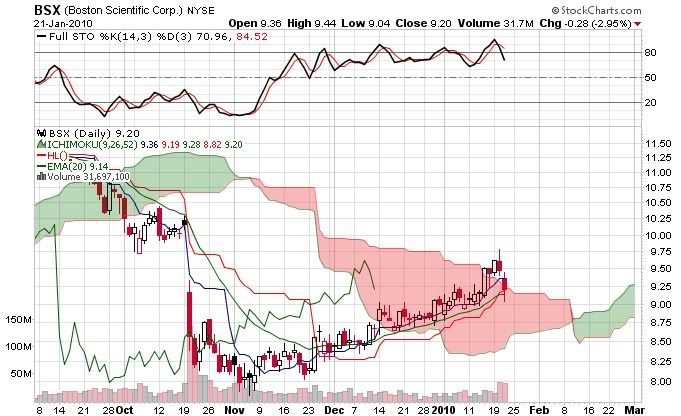
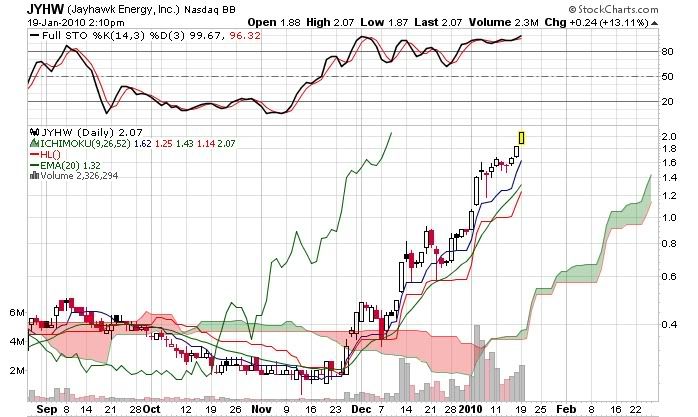
Price broke the cloud as price continued the positive trend
Going back to the 9,26,52 settings, the first thing I ask myself is where is price action located in regards to the cloud. As mentioned earlier, if it's below the cloud, but far away, I plug in 5,10,25 settings. If it's below the cloud, but close, I am looking for price to break into the cloud. For insight on if price might do this, I look to see if TS (blue line) is underneath price and supporting. Then I look at Stochastics. I look to see if stochastics are pointing up and also if it's oversold, overbought, or in the middle. If it's overbought, I may want to be careful because it will be harder for price to break into the cloud if it's currently overbought. If it's in the middle or oversold but still moving up, I can predict that this momentum has a very good chance of moving price into the cloud and breaking resistance.
Once price has moved into the cloud, I am looking at the cloud as a range for trading.
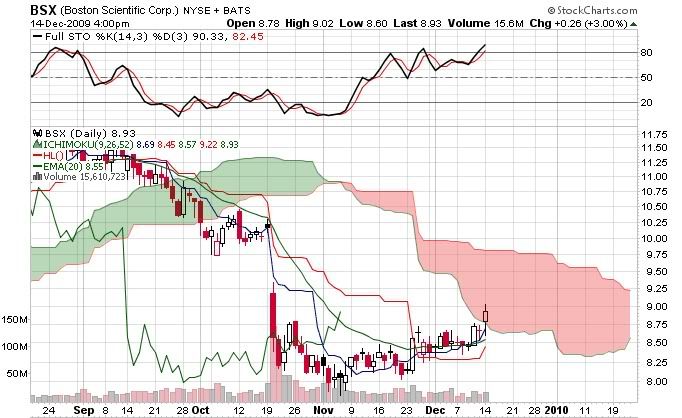
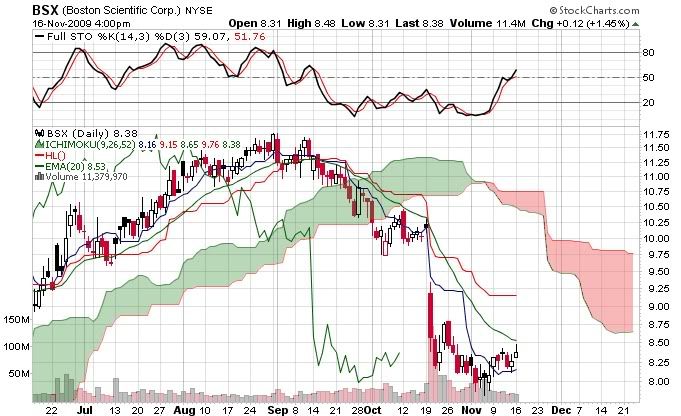
First, I look at the chart using the traditional 9,26,52 settings.
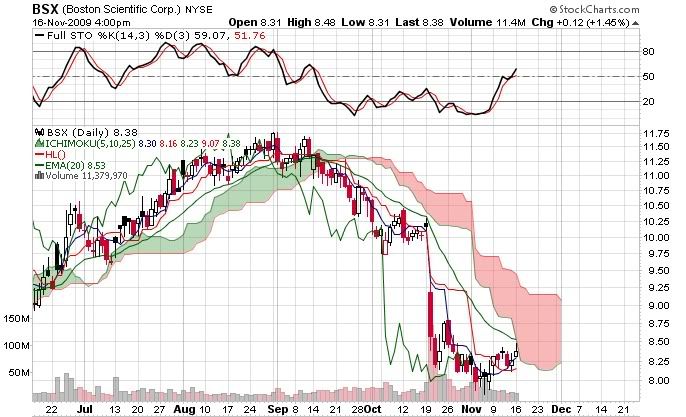
This setting alone may give me all the information I need but it may not. If price action is below the cloud and the cloud is not near the price then I may want to plug in shorter time frames for my settings. I like to use 5,10,25 for this application. You will notice that once you use these settings, the cloud is now closer to price which will give us more relevant information regarding short term price movement and sentiment.
Price broke the cloud as price continued the positive trend
Going back to the 9,26,52 settings, the first thing I ask myself is where is price action located in regards to the cloud. As mentioned earlier, if it's below the cloud, but far away, I plug in 5,10,25 settings. If it's below the cloud, but close, I am looking for price to break into the cloud. For insight on if price might do this, I look to see if TS (blue line) is underneath price and supporting. Then I look at Stochastics. I look to see if stochastics are pointing up and also if it's oversold, overbought, or in the middle. If it's overbought, I may want to be careful because it will be harder for price to break into the cloud if it's currently overbought. If it's in the middle or oversold but still moving up, I can predict that this momentum has a very good chance of moving price into the cloud and breaking resistance.
Once price has moved into the cloud, I am looking at the cloud as a range for trading.
Last edited:
")