Ichimoku Kinko Hyo trading system...!

Status
Not open for further replies.

CamelToeJoe

Well-Known Member
Stockcharts can do this hahaha. Just figured it out the other day and it's sweet.
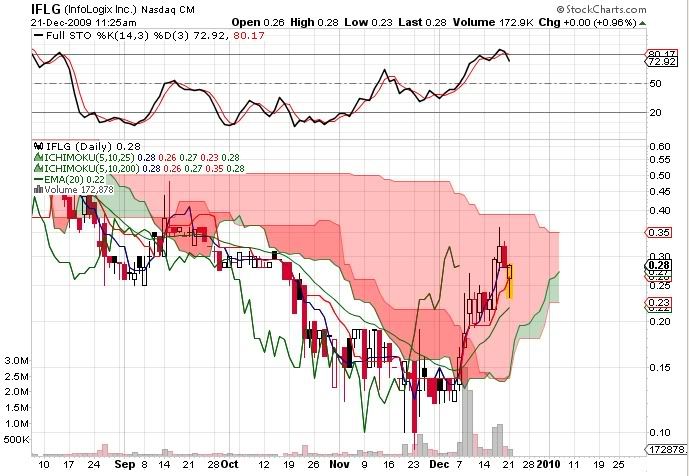
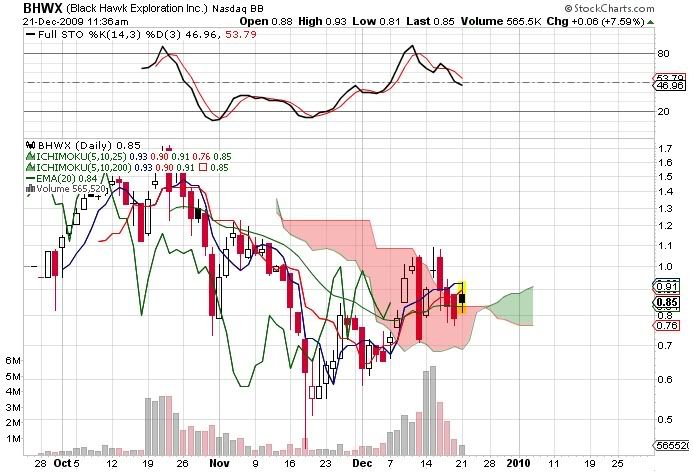
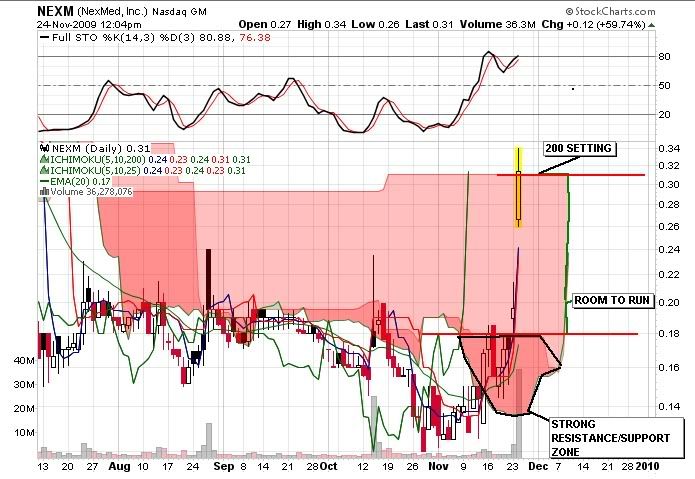
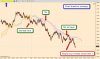
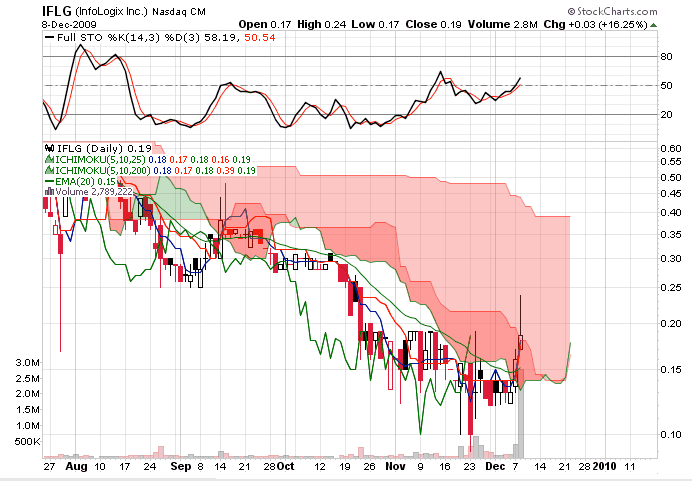
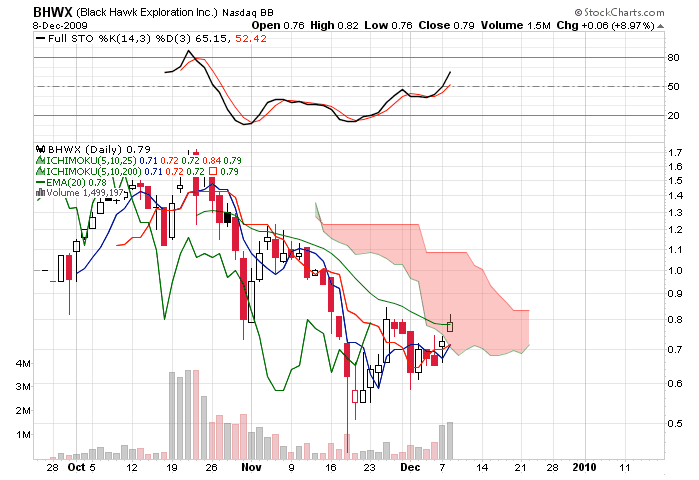
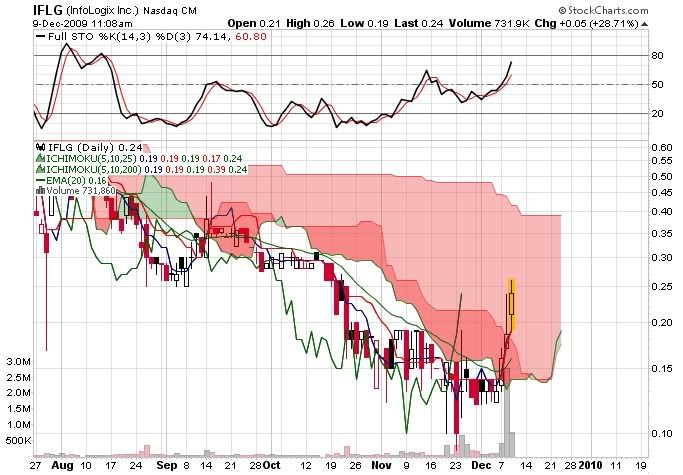
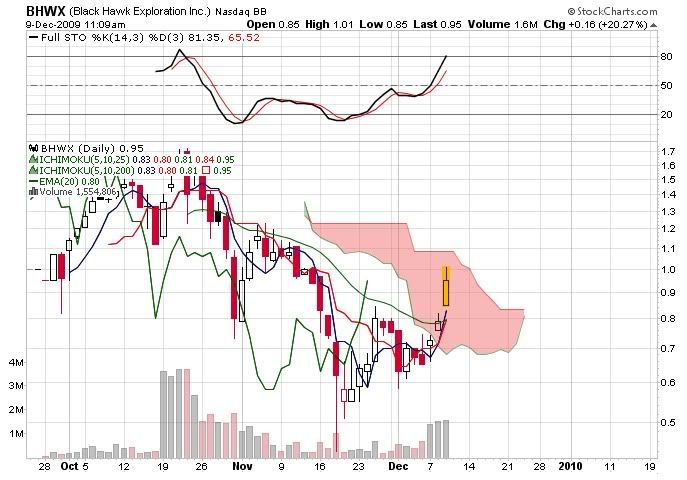
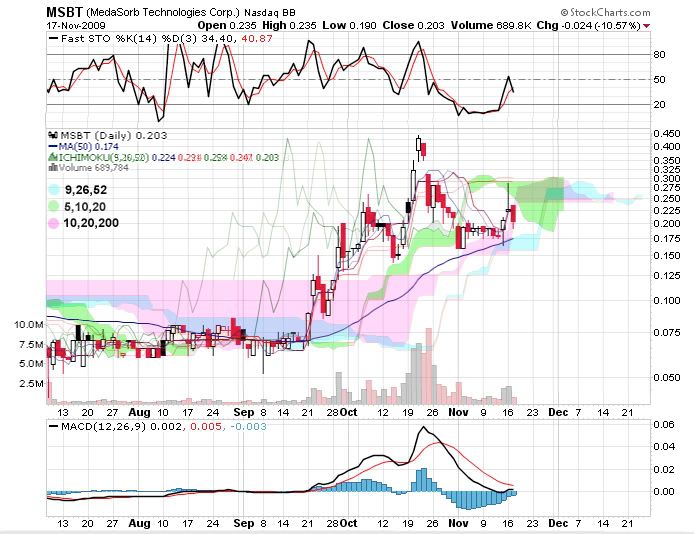
The added depth it gives is awesome. It's multidimensional. It's helpful to me if I can see all three settings at once. 9,26,52 is giving me little information at the moment. They may be giving me TS/KS signals for support, but that's it. 5,10,20 and 10,20,200 are both giving me TS/KS signals as well as kumo's support/resistance.

 
Last edited:

CamelToeJoe

Well-Known Member
What I am currently using:

Full Stochastics
Average True Range (ATR)
EMA(20)
Ichimoku 5,10,25
Sometimes I will look at the 5,10,200 settings on top of the 5,10,25 settings. It definitely gives more depth in regards to the cloud support/resistance zones.

NEXM run starting on November 13th and ending November 24th.

A) Tenkan Sen is less than the the previous close (Confirmed)
B) SSB should be on top of SSA (Confirmed)
C) Close should at least be in the cloud. Either just crossing SSA or about to cross SSB. (Confirmed on Nov. 13th.
TS, KS, and EMA(20) are all acting as support)
D) ATR and/or Full Stochastics should be increasing for the past 1 day. (Confirmed)
E) Average Volume(20) greater than 500,000. Current volume greater than 1,000,000. (Confirmed)

 
Last edited:
Hello Linkon,

On the NinjaTrader platform i use quit recently FOREX trading with Renko tick bars set to 3 ticks. This gives me i nice PA movement without time involved.
I plotted the cloud on that chart and only the cloud since i intent to trade on Kumo-breakout's.
Today i traded EUR/USD as you will see on the attached chart.
I took a good short entry and was hit due to the trailing stop from the Kumo.
But i would like to have your opinion on the point where the downtrend continued a bit later...
Would you have taken a new short position where indicated on the chart ?
I ask you this to know what to do in the future.

Thanks i lot,

Gilbert (Belgium)
 

Attachments

linkon7

Well-Known Member
Hello Linkon,

On the NinjaTrader platform i use quit recently FOREX trading with Renko tick bars set to 3 ticks. This gives me i nice PA movement without time involved.
I plotted the cloud on that chart and only the cloud since i intent to trade on Kumo-breakout's.
Today i traded EUR/USD as you will see on the attached chart.
I took a good short entry and was hit due to the trailing stop from the Kumo.
But i would like to have your opinion on the point where the downtrend continued a bit later...
Would you have taken a new short position where indicated on the chart ?
I ask you this to know what to do in the future.

Thanks i lot,

Gilbert (Belgium)
I think camel is the best among us to answer your query better.

I normally use 2 timeframe to make a buy/sell decision. And i use MACD and ema of RSI-21 as additional confirmation.

As per your charts, the pair is in a down turn and everytime it failed to break the kumo, i would add to my positions. But the add on would be in a staggered manner. if i initiate with 3 lots, i would exit 2 lots as soon as price hits Tenkan sen (9 ma) and ride other with TSL at kijun sen(26 ma). Your chart looks like a short but provided macd / rsi is supporting the short...!
 
Status
Not open for further replies.

Similar threads