


Hi,
How do you track smart money?
This is the way I do....")
Sanwaria Agro Oil Ltd - First see chart.
BUY CALL
Reason:
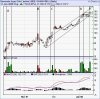
In the above chart I have drawn five points A,B,C,D & E which is explained below:
A.Volumes Higher Prices moves up from 70 to 80 indicate entry of smart money.
B.Volume Higher Prices moves down from 98 to 79 indicate exit of smart money.
C.Volume Higher Prices moves up from 83 to 111 indicate entry of smart money.
D.Volume Higher Prices moves up from 138 to 152 indicate entry of smart money.
On 11 Jan:
E.Volume higher Prices started moving up from 152 to Target indicate entry of smart money as more people started buying this stock bcz of good result declared by the company.
Target - Above 200 if the volume continue to be higher as previous.
SL It will be at or around 140/154 as its previous supp/resis.
Regards,
How do you track smart money?
This is the way I do....
Sanwaria Agro Oil Ltd - First see chart.
BUY CALL
Reason:
In the above chart I have drawn five points A,B,C,D & E which is explained below:
A.Volumes Higher Prices moves up from 70 to 80 indicate entry of smart money.
B.Volume Higher Prices moves down from 98 to 79 indicate exit of smart money.
C.Volume Higher Prices moves up from 83 to 111 indicate entry of smart money.
D.Volume Higher Prices moves up from 138 to 152 indicate entry of smart money.
On 11 Jan:
E.Volume higher Prices started moving up from 152 to Target indicate entry of smart money as more people started buying this stock bcz of good result declared by the company.
Target - Above 200 if the volume continue to be higher as previous.
SL It will be at or around 140/154 as its previous supp/resis.
Regards,
Attachments
-
 56.9 KB Views: 270