hello,
I'm quite confused about the pattern in sp500 right now:
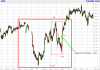
31.11.2006 thursday high was 1406.xx and fridays low was 1404 so theres some overlapping going on... this means that there cant be an impulse from the low of 1378.
what's going on?
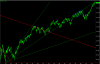
is it a running flat or a triangle? At least I was waiting for sideways correction but this bull from 1378->1418 was something what I didnt expect since 1418 is so much higher that old TOP.
What's your opinion about this?
I'm quite confused about the pattern in sp500 right now:
31.11.2006 thursday high was 1406.xx and fridays low was 1404 so theres some overlapping going on... this means that there cant be an impulse from the low of 1378.
what's going on?
is it a running flat or a triangle? At least I was waiting for sideways correction but this bull from 1378->1418 was something what I didnt expect since 1418 is so much higher that old TOP.
What's your opinion about this?