Thanks for the confirmation.
How is the target 92 arrived at ? Which tool should I use for that ?
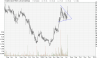
Min. target = highest pivot + pattern height
Pattern height = highest pivot - lowest pivot
Thus, if lowest pivot is at 80 and highest pivot at 92, then
min target = 90 + (90-80) = 100.
Thus we get the minimum target. This way of calculating targets is called "measure rule". But remember that this is the minimum target. Price can overshoot it by any measure. So don't jump to take short positions at the target. But if you want to do so anyways, use candlestick to identify if the price is near a reversal point.
Remember that 75% times, they as continuation patterns. Meaning, if you find this pattern in an uptrend, there are 75% chances that the prices will break upwards, in the direction of the trend. Rest 25% of the times, they act as reversal patterns.
The success rate of these triangles is VERY high, meaning, once the price breakouts(either upwards or downwards) of the boundaries, the target is almost always achieved.
Moral of the story: Symmetrical triangles are very reliable but you should wait for the price to breakout. Once broken out, trade it.


") And already broken out upwards.
And already broken out upwards.