shajans I made it in Ver 5.3, please see the Image
vidyasagar
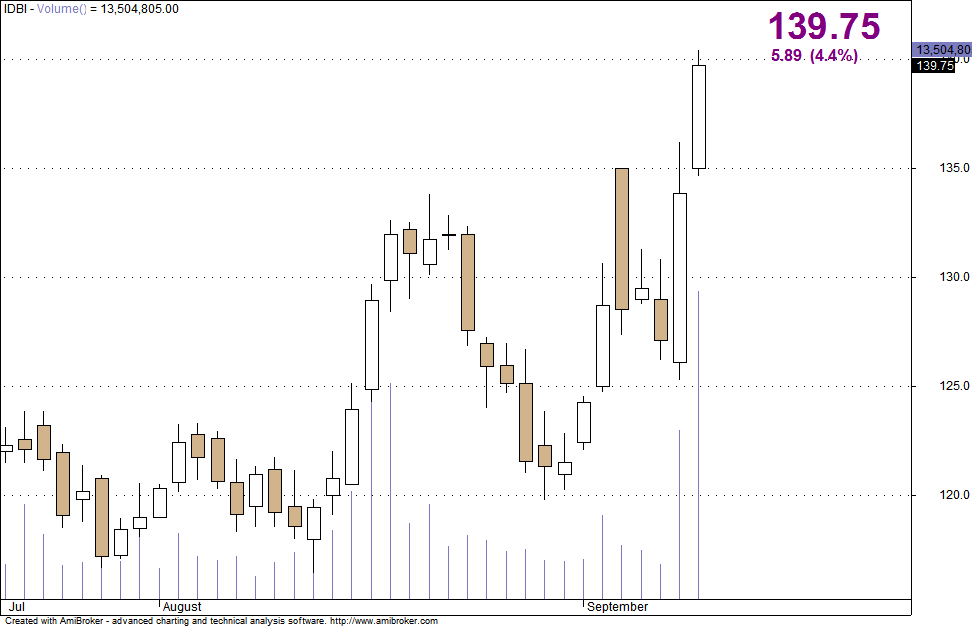
I have made a few changes, now my chart appears as detailed below:
Could you please make a few more changes:
1. A plus sign before the change, minus sign is already there.
2. IF C > YC, color = green, IF C = YC, color=blue, IF C < YC, color = red.
3. The change in price is now coming in fractions, (5.89) should it not be in multiples of 0.05 paise?.
4. 2 decimal points for C.
Thanks, looks cool.
modified code :
SetChartOptions(0,chartShowArrows|chartShowDates);
GraphXSpace=5;
Plot(C,"",colorBlack,styleCandle);
_SECTION_BEGIN("Magnified Market Price");
//by Vidyasagar,
[email protected]//
FS=Param("Font Size",28,11,100,1);
GfxSelectFont("Arial", FS, 700, italic = False, underline = False, True );
GfxSetBkMode( colorWhite );
GfxSetTextColor( ParamColor("Color",colorViolet) );
Hor=Param("Horizontal Position",766,1,1200,1);
Ver=Param("Vertical Position",1,1,1,1);
GfxTextOut(""+C,Hor , Ver );
YC=TimeFrameGetPrice("C",inDaily,-1);
DD=Prec(C-YC,2);
xx=Prec((DD/YC)*100,2);
GfxSelectFont("Arial", 12, 700, italic = False, underline = False, True );
GfxSetBkMode( colorWhite );
GfxSetTextColor(ParamColor("Color",colorViolet) );
GfxTextOut(""+DD+" ("+xx+"%)", Hor+5, Ver+45 );
_SECTION_END();
----------------------------------------------------