


Trailing Stop Loss
A trailing stop-loss order is a stoploss order in which the stop loss price is set at some fixed percentage below the current market price.
If the market price rises, the stop loss price rises proportionately, but if the stock price falls, the stop loss price doesn't change.
This robust stoploss technique allows an investor to set a limit on the maximum possible loss without setting a limit on the maximum possible gain, and without requiring paying attention to the investment on an ongoing basis.
The trailing stop-loss order is continually adjusted based on market volatility and trend always keeps at a certain distance to the market price.
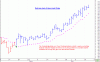
I personally use the TradersEdgeIndia.com trend trading indicator as a trailing stoploss indicator for all my trades.
Please see attached chart of how I was able to hold on to my long position in an uncertain market condition.
As can seen on the chart the magenta coloured dotted line is a trailing stoploss and it trails the stock at a distance moving only in the direction of the profitable trend.
This stoploss either only moves up or sideways to help you lock in as much profits as possible.
A trailing stop-loss order is a stoploss order in which the stop loss price is set at some fixed percentage below the current market price.
If the market price rises, the stop loss price rises proportionately, but if the stock price falls, the stop loss price doesn't change.
This robust stoploss technique allows an investor to set a limit on the maximum possible loss without setting a limit on the maximum possible gain, and without requiring paying attention to the investment on an ongoing basis.
The trailing stop-loss order is continually adjusted based on market volatility and trend always keeps at a certain distance to the market price.
I personally use the TradersEdgeIndia.com trend trading indicator as a trailing stoploss indicator for all my trades.
Please see attached chart of how I was able to hold on to my long position in an uncertain market condition.
As can seen on the chart the magenta coloured dotted line is a trailing stoploss and it trails the stock at a distance moving only in the direction of the profitable trend.
This stoploss either only moves up or sideways to help you lock in as much profits as possible.
Attachments
-
 21.3 KB Views: 828
Last edited: