


Hi all,
The best way to plot EW are:
1. Plot High and low of the day in the order of their occurence.
Personally I couldn't find a way to achieve this. Although Neely suggests a method of achieve this(manually entering values in an excel sheet), I find it tedious to implement.
2. Plot median price, (H+L)/2.
This lacks the high and low of the day, thereby missing very important data points.
Since these weren't encouraging, I tried to find some other way to plot EW:
I tried to plot waves by connecting the high and lows in the bar charts. This seems better than the previous method above.
Here is a quick description of this method:
Variables:
--Variable 'array' holds the values to be plotted
as waves.
-- H1, L1 are high and low of previous day
-- H2, L2 are high and low of current day
Method:
array =
1. High: When H2>H1 and L2>L1, ie higher high and higher low.
2. Low: When L2<L1 and H1<H2, ie lower high and lower low.
3. This case arises when either of the bar falls within the range
of the other bar. This is where the confusion arises. I wasn't
able to find the best one.
In this scenario, we take High or Low according to the "direction"
of the median price, (H+L)/2, of those two bars.
Line chart of High and Low of each day is also plotted, so that
we can overcome the inefficiency occured due to step 3 above.
ie we may refer them whenever we have confusion or confirmation
is needed.
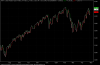
Please refer to the attached chart. I've also included an AFL for this method.
Elliotticians, let me know, whether it lacks anything or it can be improved.
Regards,
Praveen.
The best way to plot EW are:
1. Plot High and low of the day in the order of their occurence.
Personally I couldn't find a way to achieve this. Although Neely suggests a method of achieve this(manually entering values in an excel sheet), I find it tedious to implement.
2. Plot median price, (H+L)/2.
This lacks the high and low of the day, thereby missing very important data points.
Since these weren't encouraging, I tried to find some other way to plot EW:
I tried to plot waves by connecting the high and lows in the bar charts. This seems better than the previous method above.
Here is a quick description of this method:
Variables:
--Variable 'array' holds the values to be plotted
as waves.
-- H1, L1 are high and low of previous day
-- H2, L2 are high and low of current day
Method:
array =
1. High: When H2>H1 and L2>L1, ie higher high and higher low.
2. Low: When L2<L1 and H1<H2, ie lower high and lower low.
3. This case arises when either of the bar falls within the range
of the other bar. This is where the confusion arises. I wasn't
able to find the best one.
In this scenario, we take High or Low according to the "direction"
of the median price, (H+L)/2, of those two bars.
Line chart of High and Low of each day is also plotted, so that
we can overcome the inefficiency occured due to step 3 above.
ie we may refer them whenever we have confusion or confirmation
is needed.
Please refer to the attached chart. I've also included an AFL for this method.
Elliotticians, let me know, whether it lacks anything or it can be improved.
Regards,
Praveen.
Attachments
-
 17.6 KB Views: 931
Last edited:
")