


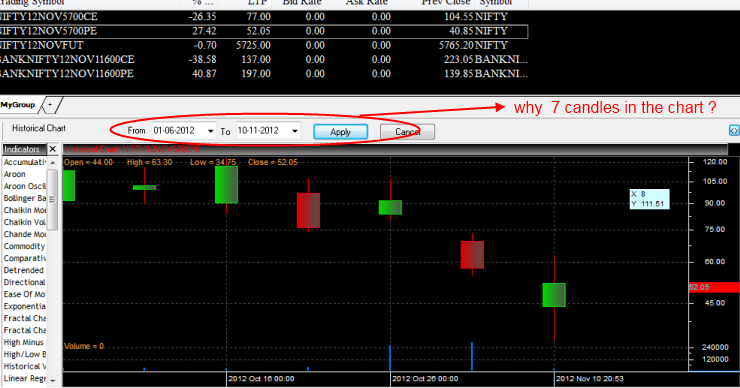
5 months but 7 candles ?
- Thread starter megapixel
- Start date

Similar threads
-
21500 points in banknifty spot in 13 months, will this survive post charges and slippage
- Started by Utkarsh Gupta007
- Replies: 1
-
-
ICICI Prudentation floating interest fund generating negative returns over last 3 months
- Started by tondudaa
- Replies: 0
-
How to write VBA code for Sort First 3 Months Data in Nse Future EOD Bhav Excel Files ?
- Started by MuthuSudhan
- Replies: 1
-
Download 1 minute IEOD for NSE-EQ, FnO, COMMODITY & CDS- ABOUT 18MONTHS DATA...!
- Started by pkgmtnl
- Replies: 19