


What is Pullback & Rally?
- Thread starter Luckytrader
- Start date
Hi friends,
Read this Article:
Entering Markets on Pullbacks from a Trend: A Best Practice in Trading
Posted by Brett Steen Barger.
Sunday, February 18, 2007
Note from Brett: This best practice post comes from professional trader, fund manager, author, and educator Ray Barros. Since he started trading 20 years ago, his track record reflects a whopping 39 percent per annum return on a compounded basis. He is also the author of two books--The Nature of Trends and The Ray Wave. Ray has been regularly featured in regional newspapers and publications, including the Sydney Morning Herald, Your Trading Edge Magazine, Business Times, and Smart Investor. I've been in touch with Ray for a while now and can vouch for his experience, insight, and dedication to teaching. In this post, he generously shares one of his favourite trading setups. His basic method is to enter trends on pullbacks, relying on the structure of the setup to provide both entry and stop. This creates a nice risk: reward ratio and, in my book, merits acknowledgment as a best practice.
From Ray:
I am writing to introduce an idea that has been around since at least the days of Richard Wyckoff (1920).
Ill describe the buy pattern; reverse the rules for a sell. The conditions for a buy are:
Identify an uptrend in the timeframe you are trading.
Identify a correction to that trend.
Within that correction, identify a swing low (A). Following A, there will be a rally to a swing high (B). That rally is followed by a new low (C).
My research shows that it is best if C is within 20% of the AB range. For example if the AB range is 20 points, and A is 1404, then it is best if C is no lower than 1402.
The calculations are: 1404 (As low) 2 (20% of the AB range of 20) = 1396. [Corrected- BNS]
While it is best that C be within 20% of AB, it need not be. But, it is essential there be no close below the 20%.
After C, the market reverses the down move and closes above A. This bar (D) must show buying conviction. In my own trading, a bar that shows buying conviction takes one of two forms:
A bar that opens no higher than in the bottom third of its daily range and closes no lower than the top third of its daily range. I call this a bull bar will stop
A bar that opens no higher than in the bottom 25% of its daily range and closes no lower than in the top 25% of its daily range. I call this a directional bar up.
The keys to this setup are
The identification of the trader's Timeframe trend and
The ability to define a corrective move.
The best tools I know to do this are Swing Charts. I like swing charts because they give a clear visual picture of the trend and they give earlier warnings of a change in the trend..
From Brett: Notice what makes this setup powerful. You're going in the direction of the longer timeframe trend, waiting for a pullback, but then requiring that the market begin to re-establish this trend before you enter. By definition, this method will not have you trying to guess price highs and lows. Rather, you'll wait for the market to make an apparent high or low and then enter when you get a bar moving convincingly in the opposite direction. My strong suspicion is that this setup could work on multiple timeframes, including intraday. Many thanks to Ray for his generous sharing of an idea that has contributed to his success.
THANKS
BULLET.
Attachments
-
 77.9 KB Views: 49
Thanks a lot friends,
Great now I know much about pullback & rally.
Thanks again specially traderji & sunil to explain it in detail.
Regards
Luckytrader
Great now I know much about pullback & rally.
Thanks again specially traderji & sunil to explain it in detail.
Regards
Luckytrader
What abt reactions ?..
don't these interest you ?... for investors these offer many more opportunities than rallies (throwbacks). Its not hard to understand why.
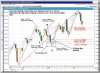
AGILENT
Last edited:
Lucky
What abt throwbacks (or 'reactions') ...
don't these interest you ?... for investors these offer many more opportunities than rallies (pullbacks). Its not hard to understand why.
AGILENT
What abt throwbacks (or 'reactions') ...
don't these interest you ?... for investors these offer many more opportunities than rallies (pullbacks). Its not hard to understand why.
AGILENT
Can you tell me when I recognise throwback the prices will move upward or downward direction?
If we recognise pullback in uptrend we get a chance to BUY
But,
If we recognise throwback in downtrend we get what???
Can you clarify some more points on this?
Regards
Luckytrader.
Somewhere I have read that in a pullback or throwback, the volume should be low. This is because, it is a counter trend to the main trend. Once the throwback or pullback is over and once the price resumes its movement in the original direction or the main trend, the volume should expand, i.e. volume should be greater than the pullback/throwback period. If you do not see volume expanding, be suspicious of the main trend. Be on the lookout for exit points from the main trend.
Regards
R. S. Iyer
Regards
R. S. Iyer
Throwback is also important but the thing is how to use it?
Can you tell me when I recognise throwback the prices will move upward or downward direction?
If we recognise pullback in uptrend we get a chance to BUY
But,
If we recognise throwback in downtrend we get what???
Can you clarify some more points on this?
Regards
Luckytrader.
Can you tell me when I recognise throwback the prices will move upward or downward direction?
If we recognise pullback in uptrend we get a chance to BUY
But,
If we recognise throwback in downtrend we get what???
Can you clarify some more points on this?
Regards
Luckytrader.
Throwback is a rally i.e. a temporary uptrend during a confimed downtrend. So prices will move up (but with lower vols)'
Its less confusing to use the terms rally (a temp uptrend) and reaction (a temp downtrend). The easy way to remember is : in sports , often a team under pressure rallies to recover lost ground .. so it has a positive implications . The word reaction has a negative connotation (e.g. adverse reaction to a medicine) . In contrast, the terms pullback and throwback, can be confusing
As to yur query in red .. u hit the nail right on the head..
")
if u can spot a rally in a bearish trend (confirmation of lower volumes is usually a good, though not the sole, indicator ... else it cd be a reversal), u get an excellent chance to short ...
That sadly leaves u with very liitle choice in India , where shorting is confined to certain scrips only.
Shorting , by the way, is a high risk/high gain game left best to the pros
AGILENT
Last edited:
Lucky
Throwback is a rally i.e. a temporary uptrend during a confimed downtrend. So prices will move up (but with lower vols)'
Its less confusing to use the terms rally (a temp uptrend) and reaction (a temp downtrend). The easy way to remember is : in sports , often a team under pressure rallies to recover lost ground .. so it has a positive implications . The word reaction has a negative connotation (e.g. adverse reaction to a medicine) . In contrast, the terms pullback and throwback, can be confusing
As to yur query in red .. u hit the nail right on the head..
if u can spot a rally in a bearish trend (confirmation of lower volumes is usually a good, though not the sole, indicator ... else it cd be a reversal), u get an excellent chance to short ...
That sadly leaves u with very liitle choice in India , where shorting is confined to certain scrips only.
Shorting , by the way, is a high risk/high gain game left best to the pros
AGILENT
Anyway, that is the reason I prefer to use two different terms for these two different events ie Throwback after a rally, and Pullback after a reaction.
The easy way to remember is TRLY, PURE.
ss
Last edited:
Nope! Now you are getting confused! Throwback is a (temporary) reaction to a rally esp after breaking out of a triangle (Deccan Airways), or say a rectangle.
Anyway, that is the reason I prefer to use two different terms for these two different events ie Throwback after a rally, and Pullback after a reaction.
The easy way to remember is TRLY, PURE.
ss
Anyway, that is the reason I prefer to use two different terms for these two different events ie Throwback after a rally, and Pullback after a reaction.
The easy way to remember is TRLY, PURE.
ss
As far as I know, TA recognises Rallies and Reactions, and does not delve into throwbacks and pullbacks (I refer Edward and Magee)
Happy to learn
AGILENT
Yes,Agilent, you are right in the sense that the word 'pullback' is shall I say loosely used in both directions, but Edward and Magee do have a definition of a Throwback in the glossary and I quote: Throwback: Return of prices to the boundary line of the pattern after a breakout to the upside. Return after a downside breakout is called a Pullback. Unquote.
Over a period of time, I think, pullback is used more often on either side, but I think it is wrong so I will stick to Throwbacks, and boy! Throwbacks give excellent entry points, and may I add Pullbacks give excellent exit points!
This thread was really good, and I learned a lot outa it.
Regards,
ss
Similar threads
-
 A Systematic Framework for Momentum and Pullback Swing Trading
- Started by spn1305
- Replies: 4
-
Systematic Momentum and Pullback Swing Trading
- Started by spn1305
- Replies: 60
-

-

-
Help Me to Create AFL for Karthik's 315 Pullback Strategy
- Started by Profittaker
- Replies: 2