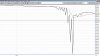
ok. now for everyone here first of all understand the chart.. a tick chart is chart not based upon a unit of time like 1 mins,5 mins, 60 mins, but based on tick. So each time a unique trade happens, the chart will update. Its a line chart and not a candle chart.
Now for all those on media and tV saying that this was due to someone making a wrong trade etc is all bullshit. This was simple a case of an algo gone berserk.. Before the huge plunge look at the line carefully.. it hardly moved.. then suddenly it started doing the 10 points up down.. it did that for 3-4 times.. then it did a couple of 50 point up downs.. finally it started doing 150point, 230 point plunge and recovery's.. i don't which trader trading manually might have done this.. doesn't make much sense to me in that argument..
anyways.. the chart is very very interesting...


")