Day Trading A Single Stock

newtrader101

Well-Known Member
#61
One thing that I completely forgot in this experiment (apart from sticking to the chosen strategy):

I didn't need to trade everyday, even though it is only one stock!
I need to trade only if there is a setup! During back testing there were many NO TRADE days!

And amusingly/alarmingly, this is how my strategy has changed:
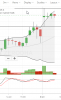
  1. 13-49 EMA Cross over and target end of day---- 0208
  2. Entered on breaking of low of 1st candle, instead of entering straight away as 13-49 was already bearish--0308
  3. Squared off when a huge buying volume appeared at 14:24 @ 1412.40, w/o waiting for cross over. It did'nt cross. Reentered @ 1411.05---- 0308 (Volume wasn't part of the strategy)
  4. Added Gann values- target and stop loss---- 0608
  5. Considered higher Time frame trend---0708
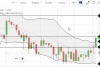
  6. I am changing my trading method to Heikin Ashi with the 13 EMA---0708
  7. Gann Hi-Lo with HeikinAshi looks even better than 13 EMA.---0708
  8. Heikin Ashi with 8EMA.---1008
  9. shifting to the 15 min or 60 min---1308

Journaling is really revealing!
Finally understood Lance Beggs' statement: The greatest book on trading is your own trading journal.
 
Last edited:

newtrader101

Well-Known Member
#62
  • Trend:
    • Daily: Bearish
1534391577088.png

  • Hourly: Bearish
1534391619097.png

  • Reasons for trade
    • (a)Same trend in trading and higher TF i.e Heikin Ashi chart price closing below 8 EMA in the 60 min and Daily charts) YES
  • Risk : reward (A maximum of 0.5) Used normal candles for this.
    1534391835860.png
  • R:R = 1/1.32=0.76
  • Value at Risk (vaR). (<=2.5% for each trade and <=5% for a day.) Risk=11.40

  • 15 mins (entry):
1534391695562.png
Waiting for stochastics to rise up and then cross bearish.

  • 9:51 am (come on, come on,...)
1534393274096.png

  • 10:31 am Finally
1534395822545.png

Entry:1404.00 TGT: Low of day
RESULT: For the first time, it hit target!
I'd also entered some more quantity with lower stop loss as shown here:
1534400794967.png

But after hitting tgt, it seemed like wanting to go on, so I entered just one more quantity at 1389.75. But then a tweezer like formation started appearing, and these usually reverse.
1534401233797.png
So exited quickly, retaining most of the profit.

Enough for today! but if it closes below the low 1388 on good volume, will enter again!
1534401334659.png
 
Last edited:

newtrader101

Well-Known Member
#63
Another opportunity seems to be presenting itself (15 min-5 min):
1534406913565.png

Short entered @ 1396.85.
I think I'm being greedy.
Exited 1402.95
There goes today's profit.

LESSON : Trade only once in a session. The Moon was VOC at the 2nd trade.
 
Last edited:

newtrader101

Well-Known Member
#65
trade only 3 pullbacks max in a trend it will make you discipline and profits will be good
This is per day, isn't it Primitive trader? Sorry but I still am trying to understand trends on different TFs. So if somebody is trading a 5 min TF, he might get a chance to trade 3 pull backs a day, is that correct? Or is it the trend on the daily chart? Which means he may daytrade the trend only on three days?
 

newtrader101

Well-Known Member
#66
Today seems to be a ranging day. Anyway trying a Bollinger bounce entry on the 5 min. I believe I'll be stopped out.
1534479436176.png


Surprisingly, it gave a profit of 7/- Auto square off at 3:15 PM.

1534512345413.png
 
Last edited:

primitivetrader

Well-Known Member
#67
This is per day, isn't it Primitive trader? Sorry but I still am trying to understand trends on different TFs. So if somebody is trading a 5 min TF, he might get a chance to trade 3 pull backs a day, is that correct? Or is it the trend on the daily chart? Which means he may daytrade the trend only on three days?
i dont use higher tfs or multi tfs i trade only on 1 time frame ie 3min if you are going with the trend then the safe bet is to trade max 3 pullbacks or at best 5 in rare circumstances as there is high probability of price reversing or going in deep correction after 3-5 pullbacks you may miss good number of opportunities but you will not get trapped in false pullback
 

newtrader101

Well-Known Member
#68
1534737860768.png


1534737914852.png

Because it has been ranging, I'm trying out the Bollinger band. If it breaks out of the band, will use the 13-49 EMA cross.
It looks oversold on the 1 hour, 15 min (not shown here) and 5 min, eventhough bullish as per the EMA cross.

So shorted @ 1406.25.
Stopped out when it broke out at 10:15.

Entered long. Tgt the next level of 1438-40.
1534741381772.png

1534740880595.png


But now it doesn't look like it is going anywhere. My mistake: entered before closure of 1 hour candle.
1534741257730.png

Did'nt hit target. Autosquare off at 3:15 @ 1408.05.
P&L =--8.80
 

Attachments

Last edited:

newtrader101

Well-Known Member
#69
I couldn't stick to the 13-49 EMA because I needed to keep checking the charts.
It'd be better to have a system where I can just enter the order and wait for it to hit target or stop loss. Gann square is the best suited for this.
I'm back testing Gann for this scrip.
 

primitivetrader

Well-Known Member
#70
Fickel mind for trader is dangerous. Every single day you are changing conditions. It shows that you have to work strongly on basics of trading
 

Similar threads