Day Trading A Single Stock

newtrader101

Well-Known Member
#51
Nifty is also bearish.
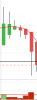
Shorted @ 1407.55. Square off 1419.65
Bought 1418.70 Exit 1413.40
Short 1413.40 Exit 1402.95
P&L: -6.95 - 2X3 = -14.95
1534132345557.png


@primitivetrader : This is interesting, as you told to just keep the MAs. Couldn't remove the price bars altogether.
1534135651273.png
 
Last edited:

newtrader101

Well-Known Member
#53
It turned out like this today (5 min):
1534160333703.png


15 MIN
1534160261666.png


60 MIN:
1534160384840.png


I must admit I'm not motivated enough to do the 5 min.
Will be shifting to the 15 min or 60 min.

Surprisingly, it'd have yielded a nice profit, even though RR is not favourable :
1534160755831.png
 
Last edited:

primitivetrader

Well-Known Member
#54
problem is that you are shorting in strength and getting long in weakness.
 

newtrader101

Well-Known Member
#56
1534228326916.png

Asian paints bullish on 60min Heikin Ashi. Bought at 1409.95.
Oh, it has not crossed the EMA:oops:.
Why is it that simple rules are so hard to follow?
1534229634826.png

15 min chart at 11 am, the time of buying.

Had to square off @ 1400.85.
1534240248199.png

P&L=-30
 

Attachments

Last edited:

primitivetrader

Well-Known Member
#57
Primitivetrader, is it RSI that indicates strength>70, weakness <30. I never had success with RSI.
i dont use rsi. but if you see your yday first short in the morning the opening candles were big and there were huge lower shadows or wicks now this simply suggest buying has emerged as lower prices are rejected on such candles.
sooner or later you have to get into basic PA learning.
 

newtrader101

Well-Known Member
#58
i dont use rsi. but if you see your yday first short in the morning the opening candles were big and there were huge lower shadows or wicks now this simply suggest buying has emerged as lower prices are rejected on such candles.
sooner or later you have to get into basic PA learning.
1534231313832.png

I see your point. Thanks for your observations.
 
Last edited:

newtrader101

Well-Known Member
#59
Should have taken a share in the <200 range. The expenses come to nearly 2.00 for Asian Paints. Anyway, will stick with it for a month and then switch to a cheaper one. This will be on the watchlist. 12 more days to go!
 
Last edited:

newtrader101

Well-Known Member
#60
Today was a losing day in commodities for me. But I continue because of the big winning day that comes in between. However, the ledger balance has been on a steady downward curve.
Time to clean up my act!

From 160818, I am logging:
  • the trade
  • its reasons ((a)Same trend in trading and higher TF i.e Heikin Ashi chart price closing above/below 8 EMA in the 60 min and Daily charts) OR (b) Entering with the Bollinger band bounce. This sounds simplistic, however will have to use a simple system till I've working knowledge of Price Action.
  • Risk : reward (A maximum of 0.5)
  • Value at Risk (vaR). The vaR will be 2.5% for each trade and 5% for a day. If the vaR > 5%, I will skip that trade, even if it is a promising one. Capital=1000. vaR per trade not greater than 50)
  • Will compound the profit
I actually had more success rate while trading with scrips selected based on daily and intraday trend aligned with Nifty intraday trend.
 
Last edited:

Similar threads