


Amibroker with IB
- Thread starter bait
- Start date
")
your code was supertrend from marketcall.in
tested in real market conditions made the file autotrading so there in no human intervention it generates a small loss in the end
tested in real market conditions made the file autotrading so there in no human intervention it generates a small loss in the end
what stratgies do you have in mind ?
let me know i will try to implement it.
let me know i will try to implement it.
in backtesting all signals are considered now here is another situation in entry actually i found a filter to take the entry that is as follows,
buy only when the next candle crosses the high of the signal candle ,
sell only if the next candle crosses the low of the signal candle .
this is the discretionary part of the system i mean it is not coded ,we have to spot it at the time now by considering both the above situations if u see manually historical data i think majority of false signals can be neglected but the thing is i dont know how to add this discretionary method into the system , iam sure if we add this part we will get more improved results of the system.
note : the delayed part of the strategy still exist.
also if we consider 1:2 risk reward ratio then we can also try exiting by this method ,means keeping the stoploss in between the fast line and slow line and considering the twice the target of stoploss for exit,then this will become pure 1:2 rr system then to be in profit we have to win more than 50% .now talking sum hypothetically lets first integrate the discretionary part into the system then wwe will think abt exit part.:thumb:
also in the mean time test this ,it is just the 2nd ver of the strategy
_SECTION_BEGIN("SuperTrend");
SetBarsRequired(100000,0);
GraphXSpace = 15;
SetChartOptions(0,chartShowArrows|chartShowDates);
/*
Heikin-Ashi(Koma-Ashi) with Moving Average Type
*/
SetChartOptions(2, chartWrapTitle);
// Calculate Moving Average
MAPeriod = Param("MA Period", 15, 1, 100);
MAOpen = EMA(Open, MAPeriod);
MAHigh = EMA(High, MAPeriod);
MALow = EMA(Low, MAPeriod);
MAClose = EMA(Close, MAPeriod);
HaClose = (MAOpen + MAHigh + MALow + MAClose) / 4;
HaOpen = AMA(Ref(HaClose, -1), 0.5);
// for graph collapse
for(i = 0; i <= MAPeriod; i++) HaClose = Null;
/*
// same
// HaOpen = (Ref(HaOpen, -1) + Ref(HaClose, -1)) / 2;
HaOpen[ 0 ] = HaClose[ 0 ];
for(i = 1; i < BarCount; i++) {
HaOpen = (HaOpen[i - 1] + HaClose[i - 1]) / 2;
}
*/
HaHigh = Max(MAHigh, Max(HaClose, HaOpen));
HaLow = Min(MALow, Min(HaClose, HaOpen));
// outs comments
"BarIndex = " + BarIndex();
"Open = " + Open;
"High = " + High;
"Low = " + Low;
"Close = "+ Close;
"HaOpen = " + HaOpen;
"HaHigh = " + HaHigh;
"HaLow = " + HaLow;
"HaClose = "+ HaClose;
// Plot graphs
_N(Title = StrFormat("{{NAME}} - {{INTERVAL}} {{DATE}} HaOpen %g, HaHigh %g,
HaLow %g, HaClose %g (%.1f%%) {{VALUES}}",
HaOpen, HaHigh, HaLow, HaClose, SelectedValue(ROC( HaClose, 1))));
PlotOHLC(HaOpen, HaHigh, HaLow, HaClose, _DEFAULT_NAME(), ParamColor("Color",
colorBlack), styleCandle);
_SECTION_BEGIN("Colour Tap");
SetChartBkGradientFill( ParamColor("BgTop", ColorRGB( 172,172,172 )),
ParamColor("BgBottom", ColorRGB( 172,172,172 )),ParamColor("titleblock",ColorRGB( 172,172,172 )));
_SECTION_END();
_N(Title = StrFormat("{{NAME}} - {{INTERVAL}} {{DATE}} Open %g, Hi %g, Lo %g, Close %g (%.1f%%) {{VALUES}}", O, H, L, C, SelectedValue( ROC( C, 1 ) ) ));
PositionSize = 350000;
TrendMode = ParamToggle("TrendMode","Off|On",1);
Factor=Optimize("Factor",4,0.1,10,0.1);
Pd=Optimize("ATR Periods",5,1,20,1);
Up=(H+L)/2+(Factor*ATR(Pd));
Dn=(H+L)/2-(Factor*ATR(Pd));
iATR=ATR(Pd);
TrendUp=TrendDown=Null;
trend[0]=1;
changeOfTrend=0;
flag=flagh=0;
for (i = 1; i <BarCount; i++) {
TrendUp = Null;
TrendDown = Null;
trend=1;
if (Close>Up[i-1]) {
trend=1;
if (trend[i-1] == -1) changeOfTrend = 1;
}
else if (Close<Dn[i-1]) {
trend=-1;
if (trend[i-1] == 1) changeOfTrend = 1;
}
else if (trend[i-1]==1) {
trend=1;
changeOfTrend = 0;
}
else if (trend[i-1]==-1) {
trend=-1;
changeOfTrend = 0;
}
if (trend<0 && trend[i-1]>0) {
flag=1;
}
else {
flag=0;
}
if (trend>0 && trend[i-1]<0) {
flagh=1;
}
else {
flagh=0;
}
if (trend>0 && Dn<Dn[i-1]){
Dn=Dn[i-1];
}
if (trend<0 && Up>Up[i-1])
{ Up=Up[i-1];
}
if (flag==1)
{ Up=(H+L)/2+(Factor*iATR);;
}
if (flagh==1)
{ Dn=(H+L)/2-(Factor*iATR);;
}
if (trend==1) {
TrendUp=Dn;
if (changeOfTrend == 1) {
TrendUp[i-1] = TrendDown[i-1];
changeOfTrend = 0;
}
}
else if (trend==-1) {
TrendDown=Up;
if (changeOfTrend == 1) {
TrendDown[i-1] = TrendUp[i-1];
changeOfTrend = 0;
}
}
}
Plot(TrendUp,"Trend",colorBlue);
Plot(TrendDown,"Down",colorRed);
/*========================================================================================================================================================================*/
/*========================================================================================================================================================================*/
/*========================================================================================================================================================================*/
TrendMode = ParamToggle("TrendMode","Off|On",1);
Factor1=Optimize("Factor1",2,5,10,2);
Pd1=Optimize("ATR Periods1",5,1,10,1);
Up1=(H+L)/2+(Factor1*ATR(Pd1));
Dn1=(H+L)/2-(Factor1*ATR(Pd1));
iATR1=ATR(Pd1);
TrendUp1=TrendDown1=Null;
trend1[0]=1;
changeOfTrend1=0;
flag1=flagh1=0;
for (i = 1; i <BarCount; i++) {
TrendUp1 = Null;
TrendDown1 = Null;
trend1=1;
if (Close>Up1[i-1]) {
trend1=1;
if (trend1[i-1] == -1) changeOfTrend1 = 1;
}
else if (Close<Dn1[i-1]) {
trend1=-1;
if (trend1[i-1] == 1) changeOfTrend1 = 1;
}
else if (trend1[i-1]==1) {
trend1=1;
changeOfTrend1 = 0;
}
else if (trend1[i-1]==-1) {
trend1=-1;
changeOfTrend1 = 0;
}
if (trend1<0 && trend1[i-1]>0) {
flag1=1;
}
else {
flag1=0;
}
if (trend1>0 && trend1[i-1]<0) {
flagh1=1;
}
else {
flagh1=0;
}
if (trend1>0 && Dn1<Dn1[i-1]){
Dn1=Dn1[i-1];
}
if (trend1<0 && Up1>Up1[i-1])
{ Up1=Up1[i-1];
}
if (flag1==1)
{ Up1=(H+L)/2+(Factor1*iATR1);;
}
if (flagh1==1)
{ Dn1=(H+L)/2-(Factor1*iATR1);;
}
if (trend1==1) {
TrendUp1=Dn1;
if (changeOfTrend1 == 1) {
TrendUp1[i-1] = TrendDown1[i-1];
changeOfTrend1 = 0;
}
}
else if (trend1==-1) {
TrendDown1=Up1;
if (changeOfTrend1 == 1) {
TrendDown1[i-1] = TrendUp1[i-1];
changeOfTrend1 = 0;
}
}
}
Plot(TrendUp1,"Trend",colorWhite);
Plot(TrendDown1,"Down",colorWhite);
/*========================================================================================================================================================================*/
/*========================================================================================================================================================================*/
/*========================================================================================================================================================================*/
Buy = trend==1 AND trend1==1 ;
Short=trend==-1 AND trend1==-1;
Sell=trend1==-1;
Cover=trend1==1;
Buy=ExRem(Buy,Sell);
Sell=ExRem(Sell,Buy);
Short=ExRem(Short,Cover);
Cover=ExRem(Cover,Short);
BuyPrice=ValueWhen(Buy,C);
SellPrice=ValueWhen(Sell,C);
ShortPrice=ValueWhen(Short,C);
CoverPrice=ValueWhen(Cover,C);
Title = EncodeColor(colorWhite)+ "Super Trend AFL code from www.marketcalls.in" + " - " + Name() + " - " + EncodeColor(colorRed)+ Interval(2) + EncodeColor(colorWhite) +
" - " + Date() +" - "+"\n" +EncodeColor(colorRed) +"Op-"+O+" "+"Hi-"+H+" "+"Lo-"+L+" "+
"Cl-"+C+" "+ "Vol= "+ WriteVal(V)+"\n"+
EncodeColor(colorLime)+
WriteIf (Buy , " GO LONG / Reverse Signal at "+C+" ","")+
WriteIf (Sell , " EXIT LONG / Reverse Signal at "+C+" ","")+"\n"+EncodeColor(colorYellow)+
WriteIf(Sell , "Total Profit/Loss for the Last Trade Rs."+(C-BuyPrice)+"","")+
WriteIf(Buy , "Total Profit/Loss for the Last trade Rs."+(SellPrice-C)+"","");
PlotShapes(IIf(Buy==1, shapeUpArrow , shapeNone), colorGreen, 0,Low, Offset=-50);
PlotShapes(IIf(Sell==1, shapeStar, shapeNone), colorRed, 0,High, Offset=30);
PlotShapes(IIf(Short==1, shapeDownArrow, shapeNone), colorRed, 0,High, Offset=-50);
PlotShapes(IIf(Cover==1, shapeStar, shapeNone), colorGreen, 0,Low, Offset=-30);
_SECTION_END();
P = ParamField("Price field",-1);
Periods = Param("Periods", 9, 2, 300, 1, 10 );
Plot( MA( P, Periods ), _DEFAULT_NAME(), ParamColor( "Color", colorCycle ), ParamStyle("Style") );
_SECTION_BEGIN("supp");
("Price");
RSIperiod = 15; // Param("RSI p",3,14,30,1);
Percent = 5; // Param("ZIG %",8,9,15,1);
EMAperiod = 5; //Param("EMA p",4,5,10,1);
HHVperiod = 8; //Param("HHV p",3,5,10,1);
NumLine = 2; //Param("Num Lines",3,1,20,1);
Base = DEMA(RSI(RSIperiod),EMAperiod);
GraphXSpace=0.5;
for( i = 1; i <= numline; i++ )
{
ResBase = LastValue(Peak(Base,Percent,i));
SupBase = LastValue(Trough(Base,Percent,i));
Plot(ValueWhen( ResBase==Base, HHV(H,HHVperiod) ), "Resist Level", colorRed, styleLine);
Plot(ValueWhen( supbase==Base, LLV(L,HHVperiod) ), "Support Level", colorGreen, styleLine);
}
_SECTION_END();
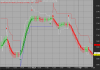
i have posted 2 images of same system will tell the diff but 1st let us know what changes i have made in this,
i have kept parameter 4 of slower st line and parameter 2 of fast st line ,by studying lot of historical charts i have found out that in intraday for tf 5min the parameter 4 of st will tell u the overall trend of the day mostly 98% of the times the rest 2 % i kept for the situation when price try to cross the slower st line but fails in this situation the color of slower line changes (ideally we consider the trend is changed ) but the price then bounces back and false signal is generated.
2- the further change i done is the hekeinshi ashi candles since our strategy is trend trading strategy the hekeinshi candles serves the purpose and filters the small whipsaws .since we want to catch the overall trend .also the hekeinshi candles are merged with moving average which can be modified from the parameter window ,i kept it 20 i think for intraday 20 will b gud also by keeping a particular moving average the cmp market price which is displayed on chart differs the realtime market price due to merging of ma and hekeinshi candles.
3-the reason for posting 2 charts of same strategy is that the st line used in my system lacks the parameter of trend mode on/off function which is present in the simple st version and u can spot the diff easily if u can add this function to our system this will be little helpfull try by urself and let me know what u feel:thumb:
_SECTION_BEGIN("SuperTrend");
SetBarsRequired(100000,0);
GraphXSpace = 15;
SetChartOptions(0,chartShowArrows|chartShowDates);
/*
Heikin-Ashi(Koma-Ashi) with Moving Average Type
*/
SetChartOptions(2, chartWrapTitle);
// Calculate Moving Average
MAPeriod = Param("MA Period", 15, 1, 100);
MAOpen = EMA(Open, MAPeriod);
MAHigh = EMA(High, MAPeriod);
MALow = EMA(Low, MAPeriod);
MAClose = EMA(Close, MAPeriod);
HaClose = (MAOpen + MAHigh + MALow + MAClose) / 4;
HaOpen = AMA(Ref(HaClose, -1), 0.5);
// for graph collapse
for(i = 0; i <= MAPeriod; i++) HaClose = Null;
/*
// same
// HaOpen = (Ref(HaOpen, -1) + Ref(HaClose, -1)) / 2;
HaOpen[ 0 ] = HaClose[ 0 ];
for(i = 1; i < BarCount; i++) {
HaOpen = (HaOpen[i - 1] + HaClose[i - 1]) / 2;
}
*/
HaHigh = Max(MAHigh, Max(HaClose, HaOpen));
HaLow = Min(MALow, Min(HaClose, HaOpen));
// outs comments
"BarIndex = " + BarIndex();
"Open = " + Open;
"High = " + High;
"Low = " + Low;
"Close = "+ Close;
"HaOpen = " + HaOpen;
"HaHigh = " + HaHigh;
"HaLow = " + HaLow;
"HaClose = "+ HaClose;
// Plot graphs
_N(Title = StrFormat("{{NAME}} - {{INTERVAL}} {{DATE}} HaOpen %g, HaHigh %g,
HaLow %g, HaClose %g (%.1f%%) {{VALUES}}",
HaOpen, HaHigh, HaLow, HaClose, SelectedValue(ROC( HaClose, 1))));
PlotOHLC(HaOpen, HaHigh, HaLow, HaClose, _DEFAULT_NAME(), ParamColor("Color",
colorBlack), styleCandle);
_SECTION_BEGIN("Colour Tap");
SetChartBkGradientFill( ParamColor("BgTop", ColorRGB( 172,172,172 )),
ParamColor("BgBottom", ColorRGB( 172,172,172 )),ParamColor("titleblock",ColorRGB( 172,172,172 )));
_SECTION_END();
_N(Title = StrFormat("{{NAME}} - {{INTERVAL}} {{DATE}} Open %g, Hi %g, Lo %g, Close %g (%.1f%%) {{VALUES}}", O, H, L, C, SelectedValue( ROC( C, 1 ) ) ));
PositionSize = 350000;
TrendMode = ParamToggle("TrendMode","Off|On",1);
Factor=Optimize("Factor",4,0.1,10,0.1);
Pd=Optimize("ATR Periods",5,1,20,1);
Up=(H+L)/2+(Factor*ATR(Pd));
Dn=(H+L)/2-(Factor*ATR(Pd));
iATR=ATR(Pd);
TrendUp=TrendDown=Null;
trend[0]=1;
changeOfTrend=0;
flag=flagh=0;
for (i = 1; i <BarCount; i++) {
TrendUp = Null;
TrendDown = Null;
trend=1;
if (Close>Up[i-1]) {
trend=1;
if (trend[i-1] == -1) changeOfTrend = 1;
}
else if (Close<Dn[i-1]) {
trend=-1;
if (trend[i-1] == 1) changeOfTrend = 1;
}
else if (trend[i-1]==1) {
trend=1;
changeOfTrend = 0;
}
else if (trend[i-1]==-1) {
trend=-1;
changeOfTrend = 0;
}
if (trend<0 && trend[i-1]>0) {
flag=1;
}
else {
flag=0;
}
if (trend>0 && trend[i-1]<0) {
flagh=1;
}
else {
flagh=0;
}
if (trend>0 && Dn<Dn[i-1]){
Dn=Dn[i-1];
}
if (trend<0 && Up>Up[i-1])
{ Up=Up[i-1];
}
if (flag==1)
{ Up=(H+L)/2+(Factor*iATR);;
}
if (flagh==1)
{ Dn=(H+L)/2-(Factor*iATR);;
}
if (trend==1) {
TrendUp=Dn;
if (changeOfTrend == 1) {
TrendUp[i-1] = TrendDown[i-1];
changeOfTrend = 0;
}
}
else if (trend==-1) {
TrendDown=Up;
if (changeOfTrend == 1) {
TrendDown[i-1] = TrendUp[i-1];
changeOfTrend = 0;
}
}
}
Plot(TrendUp,"Trend",colorBlue);
Plot(TrendDown,"Down",colorRed);
/*========================================================================================================================================================================*/
/*========================================================================================================================================================================*/
/*========================================================================================================================================================================*/
TrendMode = ParamToggle("TrendMode","Off|On",1);
Factor1=Optimize("Factor1",2,5,10,2);
Pd1=Optimize("ATR Periods1",5,1,10,1);
Up1=(H+L)/2+(Factor1*ATR(Pd1));
Dn1=(H+L)/2-(Factor1*ATR(Pd1));
iATR1=ATR(Pd1);
TrendUp1=TrendDown1=Null;
trend1[0]=1;
changeOfTrend1=0;
flag1=flagh1=0;
for (i = 1; i <BarCount; i++) {
TrendUp1 = Null;
TrendDown1 = Null;
trend1=1;
if (Close>Up1[i-1]) {
trend1=1;
if (trend1[i-1] == -1) changeOfTrend1 = 1;
}
else if (Close<Dn1[i-1]) {
trend1=-1;
if (trend1[i-1] == 1) changeOfTrend1 = 1;
}
else if (trend1[i-1]==1) {
trend1=1;
changeOfTrend1 = 0;
}
else if (trend1[i-1]==-1) {
trend1=-1;
changeOfTrend1 = 0;
}
if (trend1<0 && trend1[i-1]>0) {
flag1=1;
}
else {
flag1=0;
}
if (trend1>0 && trend1[i-1]<0) {
flagh1=1;
}
else {
flagh1=0;
}
if (trend1>0 && Dn1<Dn1[i-1]){
Dn1=Dn1[i-1];
}
if (trend1<0 && Up1>Up1[i-1])
{ Up1=Up1[i-1];
}
if (flag1==1)
{ Up1=(H+L)/2+(Factor1*iATR1);;
}
if (flagh1==1)
{ Dn1=(H+L)/2-(Factor1*iATR1);;
}
if (trend1==1) {
TrendUp1=Dn1;
if (changeOfTrend1 == 1) {
TrendUp1[i-1] = TrendDown1[i-1];
changeOfTrend1 = 0;
}
}
else if (trend1==-1) {
TrendDown1=Up1;
if (changeOfTrend1 == 1) {
TrendDown1[i-1] = TrendUp1[i-1];
changeOfTrend1 = 0;
}
}
}
Plot(TrendUp1,"Trend",colorWhite);
Plot(TrendDown1,"Down",colorWhite);
/*========================================================================================================================================================================*/
/*========================================================================================================================================================================*/
/*========================================================================================================================================================================*/
Buy = trend==1 AND trend1==1 ;
Short=trend==-1 AND trend1==-1;
Sell=trend1==-1;
Cover=trend1==1;
Buy=ExRem(Buy,Sell);
Sell=ExRem(Sell,Buy);
Short=ExRem(Short,Cover);
Cover=ExRem(Cover,Short);
BuyPrice=ValueWhen(Buy,C);
SellPrice=ValueWhen(Sell,C);
ShortPrice=ValueWhen(Short,C);
CoverPrice=ValueWhen(Cover,C);
Title = EncodeColor(colorWhite)+ "Super Trend AFL code from www.marketcalls.in" + " - " + Name() + " - " + EncodeColor(colorRed)+ Interval(2) + EncodeColor(colorWhite) +
" - " + Date() +" - "+"\n" +EncodeColor(colorRed) +"Op-"+O+" "+"Hi-"+H+" "+"Lo-"+L+" "+
"Cl-"+C+" "+ "Vol= "+ WriteVal(V)+"\n"+
EncodeColor(colorLime)+
WriteIf (Buy , " GO LONG / Reverse Signal at "+C+" ","")+
WriteIf (Sell , " EXIT LONG / Reverse Signal at "+C+" ","")+"\n"+EncodeColor(colorYellow)+
WriteIf(Sell , "Total Profit/Loss for the Last Trade Rs."+(C-BuyPrice)+"","")+
WriteIf(Buy , "Total Profit/Loss for the Last trade Rs."+(SellPrice-C)+"","");
PlotShapes(IIf(Buy==1, shapeUpArrow , shapeNone), colorGreen, 0,Low, Offset=-50);
PlotShapes(IIf(Sell==1, shapeStar, shapeNone), colorRed, 0,High, Offset=30);
PlotShapes(IIf(Short==1, shapeDownArrow, shapeNone), colorRed, 0,High, Offset=-50);
PlotShapes(IIf(Cover==1, shapeStar, shapeNone), colorGreen, 0,Low, Offset=-30);
_SECTION_END();
P = ParamField("Price field",-1);
Periods = Param("Periods", 9, 2, 300, 1, 10 );
Plot( MA( P, Periods ), _DEFAULT_NAME(), ParamColor( "Color", colorCycle ), ParamStyle("Style") );
_SECTION_BEGIN("supp");
("Price");
RSIperiod = 15; // Param("RSI p",3,14,30,1);
Percent = 5; // Param("ZIG %",8,9,15,1);
EMAperiod = 5; //Param("EMA p",4,5,10,1);
HHVperiod = 8; //Param("HHV p",3,5,10,1);
NumLine = 2; //Param("Num Lines",3,1,20,1);
Base = DEMA(RSI(RSIperiod),EMAperiod);
GraphXSpace=0.5;
for( i = 1; i <= numline; i++ )
{
ResBase = LastValue(Peak(Base,Percent,i));
SupBase = LastValue(Trough(Base,Percent,i));
Plot(ValueWhen( ResBase==Base, HHV(H,HHVperiod) ), "Resist Level", colorRed, styleLine);
Plot(ValueWhen( supbase==Base, LLV(L,HHVperiod) ), "Support Level", colorGreen, styleLine);
}
_SECTION_END();
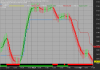
i have posted 2 images of same system will tell the diff but 1st let us know what changes i have made in this,
i have kept parameter 4 of slower st line and parameter 2 of fast st line ,by studying lot of historical charts i have found out that in intraday for tf 5min the parameter 4 of st will tell u the overall trend of the day mostly 98% of the times the rest 2 % i kept for the situation when price try to cross the slower st line but fails in this situation the color of slower line changes (ideally we consider the trend is changed ) but the price then bounces back and false signal is generated.
2- the further change i done is the hekeinshi ashi candles since our strategy is trend trading strategy the hekeinshi candles serves the purpose and filters the small whipsaws .since we want to catch the overall trend .also the hekeinshi candles are merged with moving average which can be modified from the parameter window ,i kept it 20 i think for intraday 20 will b gud also by keeping a particular moving average the cmp market price which is displayed on chart differs the realtime market price due to merging of ma and hekeinshi candles.
3-the reason for posting 2 charts of same strategy is that the st line used in my system lacks the parameter of trend mode on/off function which is present in the simple st version and u can spot the diff easily if u can add this function to our system this will be little helpfull try by urself and let me know what u feel:thumb:
Attachments
-
 26.1 KB Views: 106
 -
 25.7 KB Views: 108
Last edited:
| Thread starter | Similar threads | Forum | Replies | Date |
|---|---|---|---|---|
|
|
Amibroker Astrology Does anyone have a code and how to trade? | AmiBroker | 0 | |
| P | Amibroker AFL | AmiBroker | 5 | |
| R | Amibroker Data for 5 years | AmiBroker | 0 | |
| B | Brokers API for feeding data to amibroker | Data Feeds | 6 | |
| M | Anybody using amibroker in Chromebook with wine? | AmiBroker | 1 |
Similar threads
-
 Amibroker Astrology Does anyone have a code and how to trade?
- Started by Chaiset
- Replies: 0
-
-
-
-