FROM THE DESK OF JAYKUMAR DOSHI
NIFTY WEEKLY TECHNICAL UPDATE FOR 20-08-07 TO 24-08-07
Last week we were expecting nifty to touch the range of 4209 to 4136 minimum & on the maximum it may breach 4100.It preferred the second alternative by touching the 4002 as low of the week. It opened at 4393.6 went up to4395.5 on the same day to register the high of the week. It then continued the move down to make the low of the week on Friday at 4002.2 & finally closed at 4108.05.Thus it lost the 225.30 points on the weekly close basis. We will attempt how it behaves in the coming week in the following paragraphs.
(1)ELLIOT WAVE COUNT:- We are considering the wave count from the bottom of 16-06-06 at the 2595.65.The first probable wave count points for the completion of five wave pattern & present decline
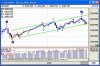
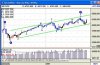
from the 4647.95 is the corrective wave. This wave count has the validity as the rise from 3554.5 dated 05-03-07 has all the characteristics of a terminal wave.This have been shown in weekly chart.
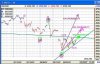
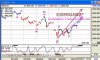
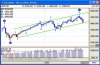
Since the 4100 is breached in less time than it took to rise from 4100.80 to 4647.95, we will consider the present correction to be of higher degree. It took 30 days to rise & retraced it completely in 17 days. At the moment there are three probable wave counts are likely & we have shown these in hourly chart as chart with three different colors. These are green, pink & violet colors. Their respective probabilities are also shown in the chart. If market does not cross 4240 in next two days than green color wave count becomes the reality. In case it is able to cross 4240 then green color wave count gets negated. Similarly a cross above 4530 will negate the pink color wave count.
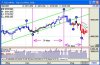
(2)JAPANESE CANDLESTICK:Last week we reported a distorted bearish engulfing line in weekly chart & an evening star in the daily chart.The effect of these patterns were seen during the week gone by.This week it has formed the long weekly black candle.This is certainly a bearish sign.However a 50% retracement of this candle is very much likely on the cards.
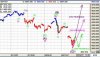
(3)CHART PATTERN:-In the weekly chart the rising channel is broken & after pull back it will start its downward journey.In the daily chart it forming the head & shoulder pattern.It is forming the right shoulder & if it does not cross the 4534 the pattern of head & shoulder will be confirmed.
(4)INDICATORS:-In the hourly chart all the indicators are bullish.In the daily all the indicators are negative & weekly are turning down.
OUTLOOK & STRATEGY:-We are expecting market to bounce back to 4440- 4510 if it is able to cross 4240.In case if it manages to breach the 4543 decisively it will head for a new high.
CHECK OUT THE CHARTS ATTACHED
NIFTY WEEKLY TECHNICAL UPDATE FOR 20-08-07 TO 24-08-07
Last week we were expecting nifty to touch the range of 4209 to 4136 minimum & on the maximum it may breach 4100.It preferred the second alternative by touching the 4002 as low of the week. It opened at 4393.6 went up to4395.5 on the same day to register the high of the week. It then continued the move down to make the low of the week on Friday at 4002.2 & finally closed at 4108.05.Thus it lost the 225.30 points on the weekly close basis. We will attempt how it behaves in the coming week in the following paragraphs.
(1)ELLIOT WAVE COUNT:- We are considering the wave count from the bottom of 16-06-06 at the 2595.65.The first probable wave count points for the completion of five wave pattern & present decline
from the 4647.95 is the corrective wave. This wave count has the validity as the rise from 3554.5 dated 05-03-07 has all the characteristics of a terminal wave.This have been shown in weekly chart.
Since the 4100 is breached in less time than it took to rise from 4100.80 to 4647.95, we will consider the present correction to be of higher degree. It took 30 days to rise & retraced it completely in 17 days. At the moment there are three probable wave counts are likely & we have shown these in hourly chart as chart with three different colors. These are green, pink & violet colors. Their respective probabilities are also shown in the chart. If market does not cross 4240 in next two days than green color wave count becomes the reality. In case it is able to cross 4240 then green color wave count gets negated. Similarly a cross above 4530 will negate the pink color wave count.
(2)JAPANESE CANDLESTICK:Last week we reported a distorted bearish engulfing line in weekly chart & an evening star in the daily chart.The effect of these patterns were seen during the week gone by.This week it has formed the long weekly black candle.This is certainly a bearish sign.However a 50% retracement of this candle is very much likely on the cards.
(3)CHART PATTERN:-In the weekly chart the rising channel is broken & after pull back it will start its downward journey.In the daily chart it forming the head & shoulder pattern.It is forming the right shoulder & if it does not cross the 4534 the pattern of head & shoulder will be confirmed.
(4)INDICATORS:-In the hourly chart all the indicators are bullish.In the daily all the indicators are negative & weekly are turning down.
OUTLOOK & STRATEGY:-We are expecting market to bounce back to 4440- 4510 if it is able to cross 4240.In case if it manages to breach the 4543 decisively it will head for a new high.
CHECK OUT THE CHARTS ATTACHED
Attachments
-
 77.5 KB Views: 203
 -
 91.7 KB Views: 173