Wolfe Waves

a1b1trader

Well-Known Member
Santosh in the Fig1 resistence level which u r showing is @ 5967 marked with green circle and in the Fig 2 u r showing resistence at 5867 marked with red circle. What do u want to convey??? How 5867 is ur predicted level? I am not getting what u r trying to tell. So, please can u clarify??
Hi DP
Nothing
He is just making fool to all of us and trying to prove himself to be a great analyst.
(BTW I do not know which Santosh is he, as there are so many Ids as Santosh and one Santosh is a good analyst.)

Hamari aankhion mein dhool jhonk raha tha.
Thinking that no one will notice his cleverness.
 

DPKAUR

Well-Known Member
"exactttttt our predict resistance level"

Bhai mere kis ko bevkoof bana rahe ho
Yehan to 100 points ka farak hai.

The resistance in first chart is 5967.36
while in other chart it is 5867.36

The difference is exactttt 100 points and you are saying it is exactttttttt.
Hahaha a1b1 you too noticed the same thing:lol::lol::lol:
 

a1b1trader

Well-Known Member
Hahaha a1b1 you too noticed the same thing:lol::lol::lol:
Yes
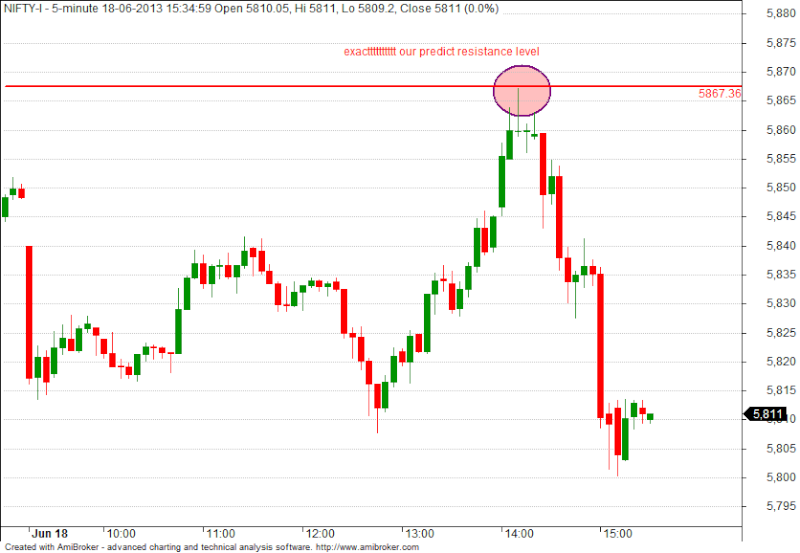
I saw the first chart in the morning, noticed the resistance circled at 5967 and said to myself

5967, yedi yehan aaj nifty pahunch gaya to maja hi aa jaayega

but a bit hesitant too as I have booked all by longs yesterday EOD and taken short position in the light of a -ww. (Rest is history.)

And when I saw the other chart in the evening and he saying exactt!!!!!, then I said to myself that

Aaj trading mein majaa to aayaa lekin us high level ka nahin

Then I searched and found the mistake and wrote the post.

:lol: :lol: :lol:
 
dear friends,
sorry now only i login after update...

sorry for wrong image update...i just update this image in wrong thread...

just image name confuse..plz leave it

i no need prove ...i am not great analysis's like yours ... i just learner...
 

Raghuveer

Well-Known Member
Santosh in the Fig1 resistence level which u r showing is @ 5967 marked with green circle and in the Fig 2 u r showing resistence at 5867 marked with red circle. What do u want to convey??? How 5867 is ur predicted level? I am not getting what u r trying to tell. So, please can u clarify??
It think he himself misread his own posts and got carried away with the excitement of being "precisely correct". I take it as a genuine mistake made due to extra enthusiasm and nothing else.

No hard feelings Santosh, please continue posting charts.
 

Raghuveer

Well-Known Member
Nifty daily +ww failed, y so?
Why +WW failed? I do not know.
In addition to what you wrote 2 other points come to mind:
1-Daily chart Head and Shoulders pattern predicting a big down move (posted with charts by so many people). This tells us to be extra careful with this +WW.

2-Generally one "reasonably safe" way to enter WW would be: stopping volume + candlestick signal. This did not happen for this WW until very late.

Earlier we saw daily +WW winning over all other smaller TF WW's. Now even daily TF WW is losing with other patterns.
Aggressive trading with blind faith in WW's (or any other method) will lead to higher losses.
I agree but my problem is:
1)On daily chart waiting for volume, candle pattens or other confirmation takes time and in process nifty moves huge on daily 50-100 points, now What I try to do is trying to catch nifty at lowest risk and cost and then get trapped :) , either even on daily chart I have to wait for proper confirmation or find out more certain entry point for +ww.


Yesterda nifty hit 5867 our first target and now let's see do we get second target?
 

Bewinner

Well-Known Member
Santosh in the Fig1 resistence level which u r showing is @ 5967 marked with green circle and in the Fig 2 u r showing resistence at 5867 marked with red circle. What do u want to convey??? How 5867 is ur predicted level? I am not getting what u r trying to tell. So, please can u clarify??
He is not trying to tell anything...He is trying to sell everything what he has...:thumb:
 

Similar threads