Some Good Steals...

Status
Not open for further replies.
AMITBE said:
Hi Rahul...glad you've had a nice weekend.
What you'vs written about That's it Rahul...and now feels like I can live without MACD for some time to come! ;)
All the best.
Hi Amitda,

I agree and I think we should give you a break from MACD for sometime. Pls see that I have underlined sometime and pls do not take it forever. :) No i am just joking..... but yes I am very clear about MACD and hopefully will not have more queries regarding it.

Thankyou soooo much

Kind Regards

Rahul
 
Last edited:
hello amit

plz advise me on reliance communication ventures limited (RCoVL)
@305.00; CMP-317.00; Day's high-339.00. should i hold it or sell?

also on ITC @196.50; CMP-208.10

thanx in advance
coolpal
 

AMITBE

Well-Known Member
chachi said:
Hi Amit,

I am going through your threads and learning. Always eagerly wait for your comments (rightly it should be lessons), as well as Saint's, Supra's, Karthik's and so many. I have always found something to learn. You look to be a born teacher.

In the process of my learning I have positioned myself on SonaSteer @ 96.05 CMP 97.50. I have attached the chart. From the chart it looks MACD histogram is trying to breach the zero from down and may start a new upward trend. Is it incorrect to take the position now as the MACD is still below zero line? The support has formed at 90 and resistance is at 107. If I am correct and if the MACD histogram comes above zero line, the target should be 107 + (107-90) = 124. Please bear with me as I am still learning. As usual I will be eagerly waiting for your comments.

As I am trying to post this CMP is 100.25...

Regards
Chachi
Hi Chachi...thanks very much for the kind words. I guess we share what we know.
Really good to see more members starting to take responsibility for what they do in the market, and towards that end, taking their study seriously.
Good going indeed.

I'm quite confortable with SonaSteer at this point, but my concern is with volume.
The latest bar has better volume than the past two bars, but even so it has to do better.
Why is volume important here.
Well, volume is important to hold up a trend in either direction and without it a trend would eventually dwindle.
But at this point it has to push the price line through a couple of important levels, in fact trendlines, to seek a clear breakout.

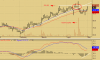
In the chart, note the two trendlines (white).
You can see the upwards sloping trendline as an important support line.
In conjunction with the horizontal top line, the sloping line forms a neat ascending triangle.
However, instead of a breakout, we see a breakdown (red ellipse).
Note the sharp spike in volume at this break down.

Now there are two levels of contention that the price has to pierce through.
One is of course the top horizontal line of the ascending triangle that had broken down. The level is 100.80.
Today's high was 100.70.

The other level that the price has to pass through is going to be formed at the point where price will meet the sloping white trendline in the future.
It's an important and a sturdy line, as can be seen by the price action along it.
I've been studying trendlines lately, especially on intraday Nifty, and often come across certain trendlins that will cause quite some difficulty for the price line on either side of it. Meaning, when the price is above such a line, it forms a firm support, but slipping under it makes it a strong resistance.
This trendline may or may not pan out quite that way, but will be worth watching. I'll chart it and if anything interesting happens, will post it.
The price may attempt to test these lines in the near term, and as they may likely give stiff resistance, I'd like to see more volume on SonaSteer.
It's the weight of strong volume, and also momentum, that can help price break past difficult levels.
This is one aspect.

Your other issue is MACD/histogram!! :eek:
Oh well...can't escape it can I. :)
Yes, the histogram as of tonight is still sloping upwards. Yes, this can be an early signal that MACD may see a bullish divergence.
As explained earlier, when the histogram crosses from below to above zero line, there is a simultanious divergence in MACD.
This divergence in MACD may happen below or above the zero line.
Divergences in MACD that happen above the zero line are much more bullish.
Ok.

My interest in MACD at this point is its use as indicative of the rate of change in momentum.
When MACD is positive and climbing, the gap between 12 EMA and 26 EMA is widening. This indicates that the rate of change of the faster EMA is higher than the rate of change for the slower EMA: Positive momentum is gaining.

It is exactly this kind of momentum, along with volume, that would help SonaSteer clear the difficult marks and move onto a breakout.

That's pretty much it, Chachi.
Bring it by again when you like.
 

Attachments

Hello Amit,

Lately i am trying to go through the chart patterns trying to identify them.
I came across the Aksh Optifibre chart,as far as i can see is it is making a rounding bottom reversal on the weekly from the december 2001.If time permits could you please give your view .

Thanks and Regards

Roneeth
 
AMITBE said:
Hi Joshi...trading the markets, it's important for you to acquire some rudimentary understanding of TA.
I'm not saying you need to spend long hours over it, but to have a couple of good books lying around may be a good idea. Pick them up as time permits, and try and familiarise yourself with at least some basic concepts, to begin with, to understand why one could consider a stock for entry, and why one should keep far away from it.
There are plenty of books around, and you could check the relevant section of the forum.

Im not going to get into it here and now in any detail, but a basic and fundamental first assessment is by simply eyeballing the daily price chart, which you can access at the BSE website.
Historic price action itself will tell you a great deal.
Another fundamental requirement for considering a trade in a stock is the trend, at least short to mid term.
Again, just observing the basic price chart would tell you all that.
Further, Simple Moving Averages would dismiss any doubt.
SMAs are the basic nuts and bolts of more advanced indicators too, so there importance cannot be ignored.

An SMA line is computed by the average price of a stock over a specified number of days, weeks or months. We are dealing with daily price here.
Mostly SMAs are created using the closing price. As an example, a 10 day simple moving average is calculated by adding the closing prices for the last 10 days and dividing the total by 10.
As the data for the new day comes in, its added to the computation while dropping the data for the first day, and so on. At any given time the 10 day SMA is being computed for the current 10 days by repeatedly dropping the first of the 10 days data as the data for the new day arrives.
The ticks thus created represent the current 10 day SMA. The ticks are then joined to form a smooth line on the price chart that moves along the main price line. When you see the actual price for the current day, you also see the 10 day average price for the current day.
Now what this exercise has done is smoothen out the price action for the 10 days by eliminating random volatility in daily price action, or noise.
So now we can calculate 10 or 20 or 50 or 200 day average price and plot all these, overlaid on the daily price chart. Of course its the software which is doing this, you just tell it the periods you wish to see the average prices forweather 10 days or 20 or whatever.

Normally a stocks price should be at least above its 20, 50 and 200 SMA to show strength in the up trend.
As traders, we buy strength, and not go bottom fishing on falling stocks.

Polaris is a good example of an utterly bearish stock.
Look at the long term daily chartterrible to say the least and a good candidate for shorting rather than buying.
In the right column certain levels are marked in blue, red, brown and black.
Blue=20 SMA=115.78
Red=50 SMA=114.65
Brown=200 SMA=126.79
Black=current price=108.35

Current price is well below all the important SMAs.
So we dont go near it. If in, we must exit.

All this is brief, but this is the basic minimum youll have to do in order to consider entry.

As for BOI, while the chart is none too pleasing either, and the sector itself is under performing, the fundamentals are strong.
For your entry, keep stops at 114.
All the best, Joshi.

Hi Amit,
Thanks a lot for simplifying the complex trading so as any laymen can understand what we should look from trading point of view.

Many thanks for your beautifull description about the trading.

Exit Polaris @ 112
And BOI@135

Many thanks once again

Regards
sjoshi
 
Phoenix Lamps

Dear Amit,

Phoenix has finally risen. When you have time, can you look at the chart.
The stock had a long consolidation period, but has finally broken with good volume: target, resistance and any other advise would be appreciated.
Thanx,
Kumar
 
AMITBE said:
Hi Joshi...trading the markets, it's important for you to acquire some rudimentary understanding of TA.
I'm not saying you need to spend long hours over it, but to have a couple of good books lying around may be a good idea. Pick them up as time permits, and try and familiarise yourself with at least some basic concepts, to begin with, to understand why one could consider a stock for entry, and why one should keep far away from it.
There are plenty of books around, and you could check the relevant section of the forum.

I’m not going to get into it here and now in any detail, but a basic and fundamental first assessment is by simply eyeballing the daily price chart, which you can access at the BSE website.
Historic price action itself will tell you a great deal.
Another fundamental requirement for considering a trade in a stock is the trend, at least short to mid term.
Again, just observing the basic price chart would tell you all that.
Further, Simple Moving Averages would dismiss any doubt.
SMAs are the basic nuts and bolts of more advanced indicators too, so there importance cannot be ignored.

An SMA line is computed by the average price of a stock over a specified number of days, weeks or months. We are dealing with daily price here.
Mostly SMAs are created using the closing price. As an example, a 10 day simple moving average is calculated by adding the closing prices for the last 10 days and dividing the total by 10.
As the data for the new day comes in, it’s added to the computation while dropping the data for the first day, and so on. At any given time the 10 day SMA is being computed for the current 10 days by repeatedly dropping the first of the 10 day’s data as the data for the new day arrives.
The ‘ticks’ thus created represent the current 10 day SMA. The ticks are then joined to form a smooth line on the price chart that moves along the main price line. When you see the actual price for the current day, you also see the 10 day average price for the current day.
Now what this exercise has done is smoothen out the price action for the 10 days by eliminating random volatility in daily price action, or ‘noise’.
So now we can calculate 10 or 20 or 50 or 200 day average price and plot all these, overlaid on the daily price chart. Of course it’s the software which is doing this, you just tell it the periods you wish to see the average prices for…weather 10 days or 20 or whatever.

Normally a stock’s price should be at least above its 20, 50 and 200 SMA to show strength in the up trend.
As traders, we buy strength, and not go bottom fishing on falling stocks.

Polaris is a good example of an utterly bearish stock.
Look at the long term daily chart…terrible to say the least and a good candidate for shorting rather than buying.
In the right column certain levels are marked in blue, red, brown and black.
Blue=20 SMA=115.78
Red=50 SMA=114.65
Brown=200 SMA=126.79
Black=current price=108.35

Current price is well below all the important SMAs.
So we don’t go near it. If in, we must exit.

All this is brief, but this is the basic minimum you’ll have to do in order to consider entry.

As for BOI, while the chart is none too pleasing either, and the sector itself is under performing, the fundamentals are strong.
For your entry, keep stops at 114.
All the best, Joshi.
Nice basics
thanks for it
I am new here learning a lot here :)
thanks amitbe for the lessons -
hope to learn more from u
 
Hi Amit,

If I see the weekly charts should we see the last tick as it will be final only after friday or the last trading day of this week. I was seeing the charts of Gujrat Ambuja cements. On the weekly it was on the uptrend and the tick ending 29/04/06 is a hammer( sorry I forgot what u call a hammer in a uptrend- i think its the shooting star). now if we see the last tick which only comprises of 2 working days of this week is a doji which further confirms a change in trend or a tentative top. So should we wait for the week to finish to see the the last tick or can we start analysing it.

On the daily it was in a sideway trend with a fight between the bull and bears and 27th it created a hammer but was below the other ticks. Can we call it a hammer. Does it confirm a change in trend if it was in sideways movement. then next day opened higher then a black candle and now a engulfing pattern but again no pre-determined trend. Can these signals in sideways trend tell us anything.

Your views please.

Regards

Rahul
 
Re: Royale Manor & Mold tek

AMITBE said:
Great trades Gaurav!
Mold Tek is a strong hold. Now it may enter some density above 84 to 115.
On the other hand the target is around 118, technically, subject to holding above 83-84. Regardless of all this, jost hold it for now. 68 is a strong support line, and 62 s/l.
Royale too is a hold. Past 44 it'll move nicely. 28 is strong support, and if you are looking for a s/l, 22-24 would be it.

Have not loked into Nelco for now.
All the best Gaurav.
Hi Amit,

Royale manor (526640) touched 44 yesterday..and closed at 41..my average is 25..
Moldtek (526263) touched 85..but closed at 81...my average is 42..

Want to know if i shud increase my exposure once they close above the resistance level mentioned by you in your reply above .........

Regards
Gaurav
 
Status
Not open for further replies.
Thread starter Similar threads Forum Replies Date
F Loans 4

Similar threads