


Hi Amit,
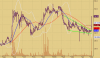
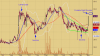
Your view on Fedder Llyod pls. 500139. I had invested in it at 167 levels. It is on circuit since then. but the circuit is like a dragon fly. Which according to candle stick is also a reversal signal if there is a confirmation next day. But the shadow of the dragon fly is becoming slow day by day. which would means the sellers are loosing. But the volume is also decreasing. What would this mean. Pls explain.
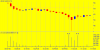
Also IPCL. please if you could explain this also considering RSI. I was seeing RSI. On 24/04/06 the closing price was same as the closing price of 08/05/06. but RSI is lower on 08/05/06. Would this mean a divergence. I am not able to analyse this. please help.
Regards
Rahul
Your view on Fedder Llyod pls. 500139. I had invested in it at 167 levels. It is on circuit since then. but the circuit is like a dragon fly. Which according to candle stick is also a reversal signal if there is a confirmation next day. But the shadow of the dragon fly is becoming slow day by day. which would means the sellers are loosing. But the volume is also decreasing. What would this mean. Pls explain.
Also IPCL. please if you could explain this also considering RSI. I was seeing RSI. On 24/04/06 the closing price was same as the closing price of 08/05/06. but RSI is lower on 08/05/06. Would this mean a divergence. I am not able to analyse this. please help.
Regards
Rahul
")