simple steps to identifty Wolfe

I found one for amibroker but gives an error.

_SECTION_BEGIN("ww");
SetChartBkColor(ParamColor("Background colour",colorBlack));

Plot(C, "", colorGrey40, styleCandle );

// Only interested in the visible bars
lastbar = Status("lastvisiblebarindex") - 3;
startBar = Status("firstvisiblebarindex");

// Some visual choices ...
BullPlot=ParamToggle("Plot bull signals", "No,Yes");
BullGuide=ParamToggle("Plot bull guides","No,Yes");
ExtendBull=ParamToggle("Extend bull plot", "No,Yes");
BullWColor=ParamColor("Bullish wave colour", colorBrightGreen);
BullTColor=ParamColor("Bullish trend colour", colorDarkGreen);

BearPlot=ParamToggle("Plot bear signals", "No,Yes");
BearGuide=ParamToggle("Plot bear guides", "No,Yes");
ExtendBear=ParamToggle("Extend bear plot", "No,Yes");
BearWColor=ParamColor("Bearish wave colour", colorRed);
BearTColor=ParamColor("Bearish trend colour", colorBrown);

// set AB's Peak/Trough percentage selection ratio
ValidDiff=1/Param("Peak ratio", 65, 0,500,5);

for(Bar = startbar; Bar < lastbar; Bar++)
{
// Build Peak and Trough arrays
P1 = Peak(H, validdiff, 1);
P1Idx = Bar - PeakBars(H, ValidDiff, 1);

P2 = Peak(H, validdiff, 2);
P2Idx = Bar - PeakBars(H, ValidDiff, 2);

T1 = Trough(L, validdiff, 1);
T1Idx = Bar - TroughBars(L, ValidDiff, 1);

T2 = Trough(Low, validdiff, 2);
T2Idx = Bar - TroughBars(L, ValidDiff, 2);

/* Test for a WolfeWave Bullish setup
*
* \ 2 + EPA
* \ Peak A is P2 / |
* \ /\ 4 / |
* \ / \ Peak C is P1 / |
* \ / \ /\ / |
* \ / \ / \ / |
* \/ \ / \ / |
* Trough X is T2 \ / \ / |
* 1 \ / \ / |
* \/ \ / |
* Trough B is T1 \/ |
* 3 5-D ETA
* Lines
* 1 - 4 = EPA
* 2 - 4 +
* 1 - 3 = ETA convergence
*/
if(BullPlot)
{
// are the peaks and troughs in the correct timewise order?
PTValid = (P1Idx[Bar] > T1Idx[Bar]) AND (T1Idx[Bar] > P2Idx[Bar])
AND (P2Idx[Bar] > T2Idx[Bar]);

// are the peaks and troughs hi's and lo's correct relatively?
HLValid = (P1[Bar] < P2[Bar]) AND (T1[Bar] < T2[Bar]) AND (P1[Bar]
> T1[Bar]);

if(PTValid AND HLValid){
// Bareish Wolfewave found. Draw pattern.
PlotXA = LineArray(T2Idx[Bar], T2[Bar], P2Idx[Bar], P2[Bar]);
Plot(PlotXA, "", BullWColor, styleLine);

PlotAB = LineArray(P2Idx[Bar], P2[Bar], T1Idx[Bar], T1[Bar]);
Plot(PlotAB, "", BullWColor, styleLine );

PlotBC = LineArray(T1Idx[Bar], T1[Bar], P1Idx[Bar], P1[Bar]);
Plot(PlotBC, "", BullWColor, styleLine);

if(BullGuide){
PlotAC = LineArray(P2Idx[Bar], P2[Bar], P1Idx[Bar], P1
[Bar],extendBull);
Plot(PlotAC, "", BullTColor, styleLine|styleNoLabel);

PlotXB = LineArray(T2Idx[Bar], T2[Bar], T1Idx[Bar], T1
[Bar],extendBull);
Plot(PlotXB, "", BullTColor, styleLine|styleNoLabel);

PlotXC = LineArray(T2Idx[Bar], T2[Bar], P1Idx[Bar], P1
[Bar],extendBull);
Plot(PlotXC, "", BullTColor, styleLine|styleNoLabel);
}
}
} // fi if(BullPlot)


/* Test for a WolfeWave Bearish setup
*
* 3 5-D ETA
* Peak B is P1 /\ |
* /\ / \ |
* 1 / \ / \ |
* Peak X is P2 / \ / \ |
* /\ / \ / \ |
* / \ / \ / \ |
* / \ / \/ \ |
* / \ / Trough C is T1 \ |
* / \/ 4 \ |
* / Trough A is T2 \ |
* / 2 + EPA
*
*
* Lines
* 1 - 4 = EPA
* 2 - 4 +
* 1 - 3 = ETA convergence
*/
if(BearPlot)
{
// are the peaks and troughs in the correct timewise order?
PTValid = (T1Idx[Bar] > P1Idx[Bar]) AND (P1Idx[Bar] > T2Idx[Bar])
AND (T2Idx[Bar] > P2Idx[Bar]);

// are the peaks and troughs hi's and lo's correct relatively?
HLValid = (P1[Bar] > P2[Bar]) AND (T1[Bar] > T2[Bar]) AND (T1[Bar]
< P1[Bar]);

if(PTValid AND HLValid){
// Bullish Wolfewave found. Draw patterns
PlotXA = LineArray(P2Idx[Bar], P2[Bar], T2Idx[Bar], T2[Bar]);
Plot(PlotXA, "", BearWColor, styleLine);

PlotAB = LineArray(T2Idx[Bar], T2[Bar], P1Idx[Bar], P1[Bar]);
Plot(PlotAB, "", BearWColor, styleLine );

PlotBC = LineArray(P1Idx[Bar], P1[Bar], T1Idx[Bar], T1[Bar]);
Plot(PlotBC, "", BearWColor, styleLine);

if(BearGuide){
PlotAC = LineArray(T2Idx[Bar], T2[Bar], T1Idx[Bar], T1
[Bar],extendBear);
Plot(PlotAC, "", BearTColor, styleLine|styleNoLabel);

PlotXB = LineArray(P2Idx[Bar], P2[Bar], P1Idx[Bar], P1
[Bar],extendBear);
Plot(PlotXB, "", BearTColor, styleLine|styleNoLabel);

PlotXC = LineArray(P2Idx[Bar], P2[Bar], T1Idx[Bar], T1
[Bar],extendBear);
Plot(PlotXC, "", BearTColor, styleLine|styleNoLabel);
}
}
} // fi if(BearPlot)
} // fi for(Bar =
_N(Title="");
_SECTION_END();

Ankit
 
V

vvvv

Guest
VVVV , i can make a try
[LegacyColorValue = true];

{=======================================HEADER=======================

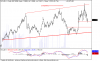
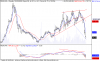
Study based on Connors & Raschke's "Wolfe Waves"

================================== DECLARATIONS =======================}

INPUTS:
TICKCHG(10), {Change (number of ticks) required to set up a new swing high/low.}
PCTCHG(.2), {Percent change in price to set up a new swing high/low}
OCCUR(1),
PLOTBARS(40),
ETALINE(TRUE),
ZIGZAG(TRUE);


ARRAY:
PBAR[50](0),
P[50](0);

VARS:
X(0),
PP(1),
JA_SLOPE1(0),
JLA_CTR(0),
JLA_LINE(0),
JAIRHBAR(0), { LAST SWING HIGH BAR}
JAIRLBAR(0), {LAST SWING LOW BAR}
LOWSEEK(FALSE), {LOOKING FOR A LOW OR A HIGH?}
W(0), {COUNTER}
JLA_IRH(0), {LAST SWING HIGH VALUE}
JLA_IRL(99999), {LAST SWING LOW VALUE}
JA_SLOPE2(0),
JA_SLOPE3(0),
JLA_PT1(0),
WOLFE(0);


{==================MAIN PROGRAM=========================}

IF CURRENTBAR = 1 THEN P[50] = C;

IF LOWSEEK = FALSE AND P[50] <= H THEN
BEGIN
P[50] = H;
PBAR[50] = 0;
END;


IF LOWSEEK = TRUE AND P[50] >= L THEN
BEGIN
P[50] = L;
PBAR[50] = 0;
END;

IF (LOWSEEK = FALSE AND PBAR[50] <> 0) THEN
BEGIN
IF (TICKCHG = 0
AND L < P[50] * ( 1 - PCTCHG / 100) )
OR (TICKCHG <> 0
AND L < ( P[50] - tickchg * minmove points)) THEN
BEGIN
IF ZIGZAG = TRUE THEN PLOT4[PBAR[50]](P[50],"SWINGS");

LOWSEEK = TRUE;

FOR W = 1 TO 49
BEGIN
PBAR[W] = PBAR[W+1];
P[W] = P[W+1];
END;

P[50] = L;
PBAR[50] = 0;
END;
END;

IF (LOWSEEK = TRUE AND PBAR[50] <> 0) THEN
BEGIN
IF (TICKCHG = 0
AND H> P[50] * ( 1 + PCTCHG / 100))
OR (TICKCHG <> 0
AND H > (P[50] + tickchg * minmove points )) THEN
BEGIN
IF ZIGZAG = TRUE THEN PLOT4[PBAR[50]](P[50],"SWINGS");
LOWSEEK = FALSE;

FOR W = 1 TO 49
BEGIN
PBAR[W] = PBAR[W+1];
P[W] = P[W+1];
END;

P[50] = H;
PBAR[50] = 0;
END;
END;


IF TIME = LASTCALCTIME
AND DATE = LASTCALCDATE
AND P[48 - PP] <> 0 THEN
BEGIN
PP = -1;
WOLFE = 0;
WHILE WOLFE < OCCUR AND PP < 46
BEGIN
PP = PP + 1;
VALUE1 = P[47-PP];
VALUE2 = P[48-PP];
VALUE3 = P[49-PP];
VALUE4 = P[50-PP];

CONDITION1 =
VALUE2 > VALUE1
AND VALUE4 > VALUE3
AND VALUE4 < VALUE2
AND VALUE3 < VALUE1
AND VALUE4 > VALUE1;

CONDITION2 =
VALUE2 < VALUE1
AND VALUE4 < VALUE3
AND VALUE4 > VALUE2
AND VALUE3 > VALUE1
AND VALUE4 < VALUE1;

IF CONDITION1 OR CONDITION2 THEN WOLFE = WOLFE + 1;
END;


JA_SLOPE1 = (P[49-PP] - P[47-PP]) / (PBAR[47-PP] - PBAR[49-PP]);
JA_SLOPE2 = (P[50-PP] - P[47-PP]) / (PBAR[47-PP] - PBAR[50-PP]);


{LINE 1-3}
VALUE90 = TL_New(DATE[PBAR[47-PP]],TIME[PBAR[47-PP]],P[47-PP],
DATE[PBAR[49-PP]], TIME[PBAR[49-PP]],P[49-PP]);
Value14=TL_SetColor(VALUE90, 5);
{VALUE93 = TL_SetExtRight(VALUE90,TRUE);}
VALUE94 = TL_SETEND(VALUE90,DATE[PBAR[49-PP]-PLOTBARS],TIME[PBAR[49-PP]-PLOTBARS],TL_GETVALUE(VALUE90,DATE[PBAR[49-PP]-PLOTBARS],TIME[PBAR[49-PP]-PLOTBARS]));

{LINE 1-4}
VALUE91 = TL_NEW(DATE[PBAR[47-PP]],TIME[PBAR[47-PP]],P[47-PP],
DATE[PBAR[50-PP]], TIME[PBAR[50-PP]],P[50-PP]);
Value14=TL_SetColor(VALUE91, 16);
TL_SETEND(VALUE91,DATE[PBAR[49-PP]-PLOTBARS],TIME[PBAR[49-PP]-PLOTBARS],TL_GETVALUE(VALUE91,DATE[PBAR[49-PP]-PLOTBARS],TIME[PBAR[49-PP]-PLOTBARS]));

{ETA LINE}

IF ETALINE THEN
BEGIN
VALUE92 = TL_NEW(DATE[PBAR[48-PP]],TIME[PBAR[48-PP]],P[48-PP],
DATE[PBAR[50-PP]], TIME[PBAR[50-PP]],P[50-PP]);
Value14=TL_SetColor(VALUE92, 4);
TL_SETEND(VALUE92,DATE[PBAR[50-PP]-PLOTBARS],TIME[PBAR[50-PP]-PLOTBARS],TL_GETVALUE(VALUE92,DATE[PBAR[50-PP]-PLOTBARS],TIME[PBAR[50-PP]-PLOTBARS]));

END;
END;

IF DATE = LASTCALCDATE
AND TIME = LASTCALCTIME
AND ZIGZAG = TRUE THEN
BEGIN
JA_SLOPE3 = (P[50] - P[49]) / (PBAR[49] - PBAR[50]);
FOR JLA_CTR = PBAR[49] DOWNTO PBAR[50]
BEGIN
PLOT4[JLA_CTR](P[49] + (PBAR[49] - JLA_CTR) * JA_SLOPE3,"Swings");
END;
END;

FOR W = 1 TO 50
BEGIN
PBAR[W] = PBAR[W]+1;
END;
 
I found one for amibroker but gives an error.

_SECTION_BEGIN("ww");
SetChartBkColor(ParamColor("Background colour",colorBlack));

Plot(C, "", colorGrey40, styleCandle );

// Only interested in the visible bars
lastbar = Status("lastvisiblebarindex") - 3;
startBar = Status("firstvisiblebarindex");

// Some visual choices ...
BullPlot=ParamToggle("Plot bull signals", "No,Yes");
BullGuide=ParamToggle("Plot bull guides","No,Yes");
ExtendBull=ParamToggle("Extend bull plot", "No,Yes");
BullWColor=ParamColor("Bullish wave colour", colorBrightGreen);
BullTColor=ParamColor("Bullish trend colour", colorDarkGreen);

BearPlot=ParamToggle("Plot bear signals", "No,Yes");
BearGuide=ParamToggle("Plot bear guides", "No,Yes");
ExtendBear=ParamToggle("Extend bear plot", "No,Yes");
BearWColor=ParamColor("Bearish wave colour", colorRed);
BearTColor=ParamColor("Bearish trend colour", colorBrown);

// set AB's Peak/Trough percentage selection ratio
ValidDiff=1/Param("Peak ratio", 65, 0,500,5);

for(Bar = startbar; Bar < lastbar; Bar++)
{
// Build Peak and Trough arrays
P1 = Peak(H, validdiff, 1);
P1Idx = Bar - PeakBars(H, ValidDiff, 1);

P2 = Peak(H, validdiff, 2);
P2Idx = Bar - PeakBars(H, ValidDiff, 2);

T1 = Trough(L, validdiff, 1);
T1Idx = Bar - TroughBars(L, ValidDiff, 1);

T2 = Trough(Low, validdiff, 2);
T2Idx = Bar - TroughBars(L, ValidDiff, 2);

/* Test for a WolfeWave Bullish setup
*
* \ 2 + EPA
* \ Peak A is P2 / |
* \ /\ 4 / |
* \ / \ Peak C is P1 / |
* \ / \ /\ / |
* \ / \ / \ / |
* \/ \ / \ / |
* Trough X is T2 \ / \ / |
* 1 \ / \ / |
* \/ \ / |
* Trough B is T1 \/ |
* 3 5-D ETA
* Lines
* 1 - 4 = EPA
* 2 - 4 +
* 1 - 3 = ETA convergence
*/
if(BullPlot)
{
// are the peaks and troughs in the correct timewise order?
PTValid = (P1Idx[Bar] > T1Idx[Bar]) AND (T1Idx[Bar] > P2Idx[Bar])
AND (P2Idx[Bar] > T2Idx[Bar]);

// are the peaks and troughs hi's and lo's correct relatively?
HLValid = (P1[Bar] < P2[Bar]) AND (T1[Bar] < T2[Bar]) AND (P1[Bar]
> T1[Bar]);

if(PTValid AND HLValid){
// Bareish Wolfewave found. Draw pattern.
PlotXA = LineArray(T2Idx[Bar], T2[Bar], P2Idx[Bar], P2[Bar]);
Plot(PlotXA, "", BullWColor, styleLine);

PlotAB = LineArray(P2Idx[Bar], P2[Bar], T1Idx[Bar], T1[Bar]);
Plot(PlotAB, "", BullWColor, styleLine );

PlotBC = LineArray(T1Idx[Bar], T1[Bar], P1Idx[Bar], P1[Bar]);
Plot(PlotBC, "", BullWColor, styleLine);

if(BullGuide){
PlotAC = LineArray(P2Idx[Bar], P2[Bar], P1Idx[Bar], P1
[Bar],extendBull);
Plot(PlotAC, "", BullTColor, styleLine|styleNoLabel);

PlotXB = LineArray(T2Idx[Bar], T2[Bar], T1Idx[Bar], T1
[Bar],extendBull);
Plot(PlotXB, "", BullTColor, styleLine|styleNoLabel);

PlotXC = LineArray(T2Idx[Bar], T2[Bar], P1Idx[Bar], P1
[Bar],extendBull);
Plot(PlotXC, "", BullTColor, styleLine|styleNoLabel);
}
}
} // fi if(BullPlot)


/* Test for a WolfeWave Bearish setup
*
* 3 5-D ETA
* Peak B is P1 /\ |
* /\ / \ |
* 1 / \ / \ |
* Peak X is P2 / \ / \ |
* /\ / \ / \ |
* / \ / \ / \ |
* / \ / \/ \ |
* / \ / Trough C is T1 \ |
* / \/ 4 \ |
* / Trough A is T2 \ |
* / 2 + EPA
*
*
* Lines
* 1 - 4 = EPA
* 2 - 4 +
* 1 - 3 = ETA convergence
*/
if(BearPlot)
{
// are the peaks and troughs in the correct timewise order?
PTValid = (T1Idx[Bar] > P1Idx[Bar]) AND (P1Idx[Bar] > T2Idx[Bar])
AND (T2Idx[Bar] > P2Idx[Bar]);

// are the peaks and troughs hi's and lo's correct relatively?
HLValid = (P1[Bar] > P2[Bar]) AND (T1[Bar] > T2[Bar]) AND (T1[Bar]
< P1[Bar]);

if(PTValid AND HLValid){
// Bullish Wolfewave found. Draw patterns
PlotXA = LineArray(P2Idx[Bar], P2[Bar], T2Idx[Bar], T2[Bar]);
Plot(PlotXA, "", BearWColor, styleLine);

PlotAB = LineArray(T2Idx[Bar], T2[Bar], P1Idx[Bar], P1[Bar]);
Plot(PlotAB, "", BearWColor, styleLine );

PlotBC = LineArray(P1Idx[Bar], P1[Bar], T1Idx[Bar], T1[Bar]);
Plot(PlotBC, "", BearWColor, styleLine);

if(BearGuide){
PlotAC = LineArray(T2Idx[Bar], T2[Bar], T1Idx[Bar], T1
[Bar],extendBear);
Plot(PlotAC, "", BearTColor, styleLine|styleNoLabel);

PlotXB = LineArray(P2Idx[Bar], P2[Bar], P1Idx[Bar], P1
[Bar],extendBear);
Plot(PlotXB, "", BearTColor, styleLine|styleNoLabel);

PlotXC = LineArray(P2Idx[Bar], P2[Bar], T1Idx[Bar], T1
[Bar],extendBear);
Plot(PlotXC, "", BearTColor, styleLine|styleNoLabel);
}
}
} // fi if(BearPlot)
} // fi for(Bar =
_N(Title="");
_SECTION_END();

Ankit
This AFL is giving errors, when u use"Plot Bull/Bear Signals" in the Parameters window.
Any suggestions on how 2 make it work?
 

Similar threads