Simple Coding Help - No Promise.

Hi,

Require help for coding.

i want code that will generate buy or sell signal at the end of every 5 minute candle. On close of every candle signal has to be generated that will fire limit order in auto trading.

Please help.
 

travi

Well-Known Member
Hi,

Require help for coding.

i want code that will generate buy or sell signal at the end of every 5 minute candle. On close of every candle signal has to be generated that will fire limit order in auto trading.

Please help.
since your strategy is not conspicuous, a simple way is to run your AFL every 5min from Analysis settings > auto-repeat
 
Dear Happyji and Seniors ,
I am new to Amibroker and its AFL language. I Want Daily 5 EMA (High), 5 EMA (Close) and 5 EMA (Low) to be plotted on 1 Min. chart.
Whether the following codes are correct? If not I request you to correct the same.
Whether it will give Daily 5 EMA (High), 5 EMA (Close) and 5 EMA (Low) on all Intraday Chart?
Please help

_SECTION_BEGIN("EMA CLOSE DAILY");
TimeFrameSet(inDaily);
e5d= EMA(Close,5) ;
Plot(TimeFrameExpand(e5d, inDaily), "", ParamColor( "Daily Color", colorWhite ), ParamStyle("Style", styleLine));
TimeFrameRestore();
_SECTION_END();

_SECTION_BEGIN("EMA HIGH DAILY");
TimeFrameSet(inDaily);
e5d= EMA(high,5) ;
Plot(TimeFrameExpand(e5d, inDaily), "", ParamColor( "Daily Color", colorGreen ), ParamStyle("Style", styleDashed));
TimeFrameRestore();
_SECTION_END();

_SECTION_BEGIN("EMA LOW DAILY");
TimeFrameSet(inDaily);
e5d= EMA(Low,5) ;
Plot(TimeFrameExpand(e5d, inDaily), "", ParamColor( "Daily Color", colorRed ), ParamStyle("Style", styleDashed));
TimeFrameRestore();
_SECTION_END();

Thanks
Seniors Please Please let me hear something about my quarry.
Thanks
 
Seniors Please Please let me hear something about my quarry.
Thanks
Yes this will give you the Daily 5 EMA line in intraday chart. Here i simplified the code.

_SECTION_BEGIN("EMA CLOSE DAILY");
TimeFrameSet(inDaily);
e5d= EMA(C,5) ;
e5l= EMA(L,5);
e5h= EMA(H,5);
TimeFrameRestore();


e5dExpand = TimeFrameExpand(e5d, inDaily);
e5lExpand = TimeFrameExpand(e5l, inDaily);
e5hExpand = TimeFrameExpand(e5h, inDaily);

Plot( e5dExpand , "", colorWhite, styleLine| stylethick);
Plot( e5lExpand , "", colorRed, styleLine| styleThick|styleDashed);
Plot( e5hExpand , "", colorGreen, styleLine| styleThick|styledashed);

_SECTION_END();
 
since your strategy is not conspicuous, a simple way is to run your AFL every 5min from Analysis settings > auto-repeat
Hi,

Below is my strategy/afl
Filter=1;


RSI14=RSI(14);
FutSellRSI=(85*C)/Ref(RSI14,-1);
FutbuyRSI=(15*C)/Ref(RSI14,-1);
AddColumn(RSI14,"rsi14",1.2);
AddColumn(futsellRSI,"futsellRSI",1.2);
AddColumn(Futbuyrsi,"futbuyrsi",1.2);
Plot(RSI14,"RSI14",colorRed,styleLine);
Oversold=15;
Overbought=85;
Plot(Oversold,"OS",styleLine,colorBlue);
Plot(Overbought,"Ob",styleLine,colorOrange);


My strategy is trying to find a price in future when the RSI will be above 85 or below 15. I want my strategy to buy or sell ie. place a bracket order in kite at that price
I want buy and sell signals generated at the end of every 5 minute candle - so that my order can be modified/updated by the new value of future RSI in kite in auto trading.


Request you to help.

thanks.
 
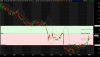
this alf has three lines to draw en entry line ,tg taget line,sl stoploss line
put his afl on plane candlestick chart
draw horizontal line on chart -double click on it -in study id type en entry line
same as short form for tg and stoploss
i request to seneours please add buy sell signal on this afl
means when price touch en -entry line buy/ sell signal generate
buy if sl is put below and target place above EN line
sell if SL i put above and target TG line below En line
square off as target or stoploss hit first


Plot(C, "Price", colorBlack, styleCandle,Null,Null,0);
_SECTION_BEGIN("risk profile");

SetBarsRequired(1000000,1000000);
BlankBarsInRightMargin = 25;
LastVisiblebar = Status("firstvisiblebarindex");
FirstVisibleBar= Status("lastvisiblebarindex")-BlankBarsInRightMargin;

Entry_Study = Study("EN", GetChartID() );
Entry = LastValue( ValueWhen( ExRem( Entry_Study, 0 ), Entry_Study ) );

Target_Study = Study("TG", GetChartID() );
Target = LastValue( ValueWhen( ExRem( Target_Study, 0 ), Target_Study ) );

StopLoss_Study = Study("SL", GetChartID() );
StopLoss = LastValue( ValueWhen( ExRem( StopLoss_Study, 0 ), StopLoss_Study ) );

Reward=Target-Entry;
Risk=Entry-StopLoss;
RRR=Reward/Risk;
p_reward=reward*100/Entry;
p_Risk=Risk*100/Entry;

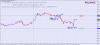
PlotText("StopLoss: "+StopLoss,FirstVisibleBar-2,StopLoss,colorBlack);
PlotText("Entry: "+Entry,FirstVisibleBar-2,Entry,colorBlack);
PlotText("Entry",LastVisiblebar+2,Entry,colorBlack);
PlotText("Target: "+Target,FirstVisibleBar-2,Target,colorBlack);
PlotText("Target",LastVisiblebar+2,Target,colorBlack);
PlotText("Stoploss",LastVisiblebar+2,StopLoss,colorBlack);
PlotText("Risk: "+Prec(abs(Risk), 2 )+" (%"+Prec(abs(P_Risk), 2 )+")",FirstVisibleBar-2,StopLoss+Risk/2,colorRed);
PlotText("Reward: "+Prec(abs(Reward), 2 )+" (%"+Prec(abs(p_reward), 2 )+")",FirstVisibleBar-2,Entry+Reward/2,colorGreen);
PlotText("RRR: "+Prec(abs(RRR), 2 ),FirstVisibleBar-30,StopLoss,colorBlack);

PlotOHLC( Entry, Entry, Target, Target, "", ColorRGB(220,250,220),styleCloud|styleNoRescale,Null,Null,20 );
PlotOHLC( Entry, Entry, StopLoss, StopLoss, "", ColorRGB(250,220,220),styleCloud|styleNoRescale,Null,Null,20 );

_SECTION_END();
 

Attachments

Similar threads