


Can some body help me to add below request in this afl. i picked up this afl from net only.
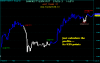
It plots Williams VIX FIX line and in title it gives number.
Is there any way to display in Title last 3 candle sumup value of Williams VIX FIX separately in title? If yes please help me to add the same
_SECTION_BEGIN("Unnamed 64");
_N(Title = StrFormat(FullName() + "  {{INTERVAL}} {{DATE}} Open %g, High %g, Low %g, Close %g (%.1f%%) Volume " +WriteVal( V, 1.0 ) +"\n{{VALUES}}", O, H, L, C, SelectedValue( ROC( C, 1 )) ));
WVF = (HHV (Close,22) - Low)/(HHV(Close,22))*100;

Plot(WVF, "Williams VIX FIX", colorBlue, styleLine);
_SECTION_END();
It plots Williams VIX FIX line and in title it gives number.
Is there any way to display in Title last 3 candle sumup value of Williams VIX FIX separately in title? If yes please help me to add the same
_SECTION_BEGIN("Unnamed 64");
_N(Title = StrFormat(FullName() + " {{INTERVAL}} {{DATE}} Open %g, High %g, Low %g, Close %g (%.1f%%) Volume " +WriteVal( V, 1.0 ) +"\n{{VALUES}}", O, H, L, C, SelectedValue( ROC( C, 1 )) ));
WVF = (HHV (Close,22) - Low)/(HHV(Close,22))*100;
Plot(WVF, "Williams VIX FIX", colorBlue, styleLine);
_SECTION_END();
Plot(WVF+Ref(WVF,-1)+Ref(WVF,-2), "Sum up", colorBlue, styleNoLine | styleNoRescale);
")