


Simple Coding Help - No Promise.
- Thread starter Happy_Singh
- Start date
i need afl which plot previous day high/low and close lines on the today chart
-----
x=LastVisibleValue(DateNum());
Cond=BarsSince(DateNum()<x);
y=Ref(DateNum(),-Cond);
Cond1=BarsSince(DateNum()<LastValue(y));
z=Cond1-Cond;
Hi=Ref(HHV(H,z),-Cond);
Hibar=Ref(HHVBars(H,z),-Cond)+Cond;
x0=BarCount-1-LastValue(Hibar);
x1=BarCount-1;
y0=LastValue(Hi);
y1=y0;
Line = LineArray( x0, y0, x1, y1, 1 );
Plot( Line, "high line", ParamColor("high line", colorGreen),styleThick );
pc=Ref(Close,-Cond);
x10=BarCount-1-LastValue(Cond);
x11=BarCount-1;
y10=LastValue(pc);
y11=y10;
Line1=LineArray( x10, y10, x11, y11, 1 );
Plot( Line1, "Close line", ParamColor("close line", colorWhite),styleThick );
Lo=Ref(LLV(L,z),-Cond);
Lobar=Ref(LLVBars(L,z),-Cond)+Cond;
x00=BarCount-1-LastValue(Lobar);
x01=BarCount-1;
y00=LastValue(Lo);
y01=y00;
Line11=LineArray(x00,y00,x01,y01,1);
Plot(Line11,"Low Line",ParamColor("Low line", colorBlue),styleThick);
------
Hi lvgandhi,
Can you include today's Hi and Low in your code?
Thnx in advance.
Regards,
Kedarmnath
Can you include today's Hi and Low in your code?
Thnx in advance.
Regards,
Kedarmnath
Plot(IIf(ToDay == Day(),TimeFrameGetPrice( "H", inDaily, 0 ),Null),"",colorOrange,styleThick);
Plot(IIf(ToDay == Day(),TimeFrameGetPrice( "L", inDaily, 0 ),Null),"",colorTurquoise,styleThick);
Hi lvgandhi,
Thnx a lot...for sharing knowledge with us...god bless you.
I am posting chart which i use to watch but with your coding i will have better historical viewing.
If you good with afl coding then i want some query's for alerts as well as for exploration conditions which v can short list with exploration....i will post details if you help us in that.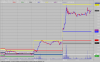
Regards,
Kedarnath
Could you please add buy/sell signal as per picture (http://s22.postimg.org/67yf8s8u9/MACD.jpg) for auto analysis on following afl, thanks in advance.
/*****************************************
KH_MACD
created by KelvinHand in 2012 Oct 6th
MACD Option:
* Classic 2 lines
* MT4 Style
*****************************************/
_SECTION_BEGIN("KH_MACD");
SetChartBkGradientFill( ParamColor("BgTop", colorBlack),ParamColor("BgBottom", colorBlack), colorBlack);
iOpt = ParamList("MACD Option", "Classic|MT4", 1);
cMACD = ParamColor("MACD Color", colorWhite);
cSig=ParamColor("Signal color", colorRed );
fastEMA = Param( "Fast EMA", 12, 1, 200, 1 );
slowEMA = Param( "Slow EMA", 26, 1, 200, 1 );
SigSMA = Param( "MACD SMA", 9, 1, 200, 1 );
iMACD=EMA(C, fastEMA) - EMA(C,slowEMA);
iSignal=MA(iMACD,SigSMA);
Plot( iSignal, "", cSig, styleThick|styleNoLabel);
_N(Title = StrFormat("MACD(%g, %g, %g) %g, %g", fastEMA, slowEMA, SigSMA, iMacd, iSignal));
switch (iOpt)
{
case "MT4":
Plot( iMACD, "", cMACD, styleThick|styleHistogram|styleNoLabel);
break;
default:
Plot( iMACD, "", cMACD, styleThick|styleNoLabel);
break;
}
Plot( 0, "", colorGrey40, styleNoLabel);
K = Plot(MACD(),"MACD",colorGrey40,styleThick| styleOwnScale);
Plot( Volume, "Volume", IIf( C > O, ParamColor("Up Color", colorYellow ), ParamColor("Down Color", colorBlack ) ), ParamStyle( "Style", styleHistogram | styleThick | styleLeftAxisScale, maskHistogram ) );
Title = EncodeColor(colorWhite) + Name() +
EncodeColor(colorBlue)+ " KRA Line= "+ EncodeColor(colorYellow)+ WriteVal(K,format=1.2) ;
Hi lvgandhi,
Thnx a lot...for sharing knowledge with us...god bless you.
I am posting chart which i use to watch but with your coding i will have better historical viewing.
If you good with afl coding then i want some query's for alerts as well as for exploration conditions which v can short list with exploration....i will post details if you help us in that. View attachment 20046
Regards,
Kedarnath
http://i59.tinypic.com/nxlsmd.png
Hi can any one help me to code formula when All the 5 charts in pic gives Buy sell signal in 15 min chart.This setup consist of 5 diffrent Afl.If you see white line in chart at that point all Afl are giving sell signal.
I want to add buy sell signal
Most important I want to scan real time so that I can find which stock is giving Buy or Sell signal on the basis of above 5 charts.
Could you please add buy/sell signal as per picture (http://s22.postimg.org/67yf8s8u9/MACD.jpg) for auto analysis on following afl, thanks in advance.
/*****************************************
KH_MACD
created by KelvinHand in 2012 Oct 6th
MACD Option:
* Classic 2 lines
* MT4 Style
*****************************************/
_SECTION_BEGIN("KH_MACD");
SetChartBkGradientFill( ParamColor("BgTop", colorBlack),ParamColor("BgBottom", colorBlack), colorBlack);
iOpt = ParamList("MACD Option", "Classic|MT4", 1);
cMACD = ParamColor("MACD Color", colorWhite);
cSig=ParamColor("Signal color", colorRed );
fastEMA = Param( "Fast EMA", 12, 1, 200, 1 );
slowEMA = Param( "Slow EMA", 26, 1, 200, 1 );
SigSMA = Param( "MACD SMA", 9, 1, 200, 1 );
iMACD=EMA(C, fastEMA) - EMA(C,slowEMA);
iSignal=MA(iMACD,SigSMA);
Plot( iSignal, "", cSig, styleThick|styleNoLabel);
_N(Title = StrFormat("MACD(%g, %g, %g) %g, %g", fastEMA, slowEMA, SigSMA, iMacd, iSignal));
switch (iOpt)
{
case "MT4":
Plot( iMACD, "", cMACD, styleThick|styleHistogram|styleNoLabel);
break;
default:
Plot( iMACD, "", cMACD, styleThick|styleNoLabel);
break;
}
Plot( 0, "", colorGrey40, styleNoLabel);
K = Plot(MACD(),"MACD",colorGrey40,styleThick| styleOwnScale);
Plot( Volume, "Volume", IIf( C > O, ParamColor("Up Color", colorYellow ), ParamColor("Down Color", colorBlack ) ), ParamStyle( "Style", styleHistogram | styleThick | styleLeftAxisScale, maskHistogram ) );
Title = EncodeColor(colorWhite) + Name() +
EncodeColor(colorBlue)+ " KRA Line= "+ EncodeColor(colorYellow)+ WriteVal(K,format=1.2) ;
/*****************************************
KH_MACD
created by KelvinHand in 2012 Oct 6th
MACD Option:
* Classic 2 lines
* MT4 Style
*****************************************/
_SECTION_BEGIN("KH_MACD");
SetChartBkGradientFill( ParamColor("BgTop", colorBlack),ParamColor("BgBottom", colorBlack), colorBlack);
iOpt = ParamList("MACD Option", "Classic|MT4", 1);
cMACD = ParamColor("MACD Color", colorWhite);
cSig=ParamColor("Signal color", colorRed );
fastEMA = Param( "Fast EMA", 12, 1, 200, 1 );
slowEMA = Param( "Slow EMA", 26, 1, 200, 1 );
SigSMA = Param( "MACD SMA", 9, 1, 200, 1 );
iMACD=EMA(C, fastEMA) - EMA(C,slowEMA);
iSignal=MA(iMACD,SigSMA);
Plot( iSignal, "", cSig, styleThick|styleNoLabel);
_N(Title = StrFormat("MACD(%g, %g, %g) %g, %g", fastEMA, slowEMA, SigSMA, iMacd, iSignal));
switch (iOpt)
{
case "MT4":
Plot( iMACD, "", cMACD, styleThick|styleHistogram|styleNoLabel);
break;
default:
Plot( iMACD, "", cMACD, styleThick|styleNoLabel);
break;
}
Plot( 0, "", colorGrey40, styleNoLabel);
K = Plot(MACD(),"MACD",colorGrey40,styleThick| styleOwnScale);
Plot( Volume, "Volume", IIf( C > O, ParamColor("Up Color", colorYellow ), ParamColor("Down Color", colorBlack ) ), ParamStyle( "Style", styleHistogram | styleThick | styleLeftAxisScale, maskHistogram ) );
Title = EncodeColor(colorWhite) + Name() +
EncodeColor(colorBlue)+ " KRA Line= "+ EncodeColor(colorYellow)+ WriteVal(K,format=1.2) ;
Buy = Cross( iMACD, iSignal );
Sell = Cross( iSignal, iMACD );
Buy = ExRem( Buy, Sell );
Sell = ExRem( Sell, Buy );
PlotShapes( Buy * shapeUpArrow + Sell * shapedownarrow, IIf( Buy, colorBrightGreen, colorRed ), 0, iMACD, 20 );
Similar threads
-
Convert Simple Thinkscript Support/Resistance Lines into AFL
- Started by StockTempest
- Replies: 4
-
-
Coding help.........adding exploration for the simple combo
- Started by praveen5344
- Replies: 2
-
Help with simple coding...........SUPERTREND AND STOCHASTICS
- Started by praveen5344
- Replies: 3
-