Reference Material

vagar11

Well-Known Member
#11
Three bar Reversal strategy:

This is one of the most successful trading pattern.

For Buy:

1.The first candle makes a low.

2.The second candle makes a lower low.

3.The third candle makes a higher low


For Short:

1.The first candle makes a high.
2.The second candle makes a higher high.
3.The third candle makes a lower high.


vagar11

Well-Known Member
#12
TD Sequential
What is it for?
Applying Tom DeMark’s TD Sequential serves the purpose of identifying a price point where an uptrend or a downtrend exhausts itself and reverses.
.
What are the main components of TD Sequential?
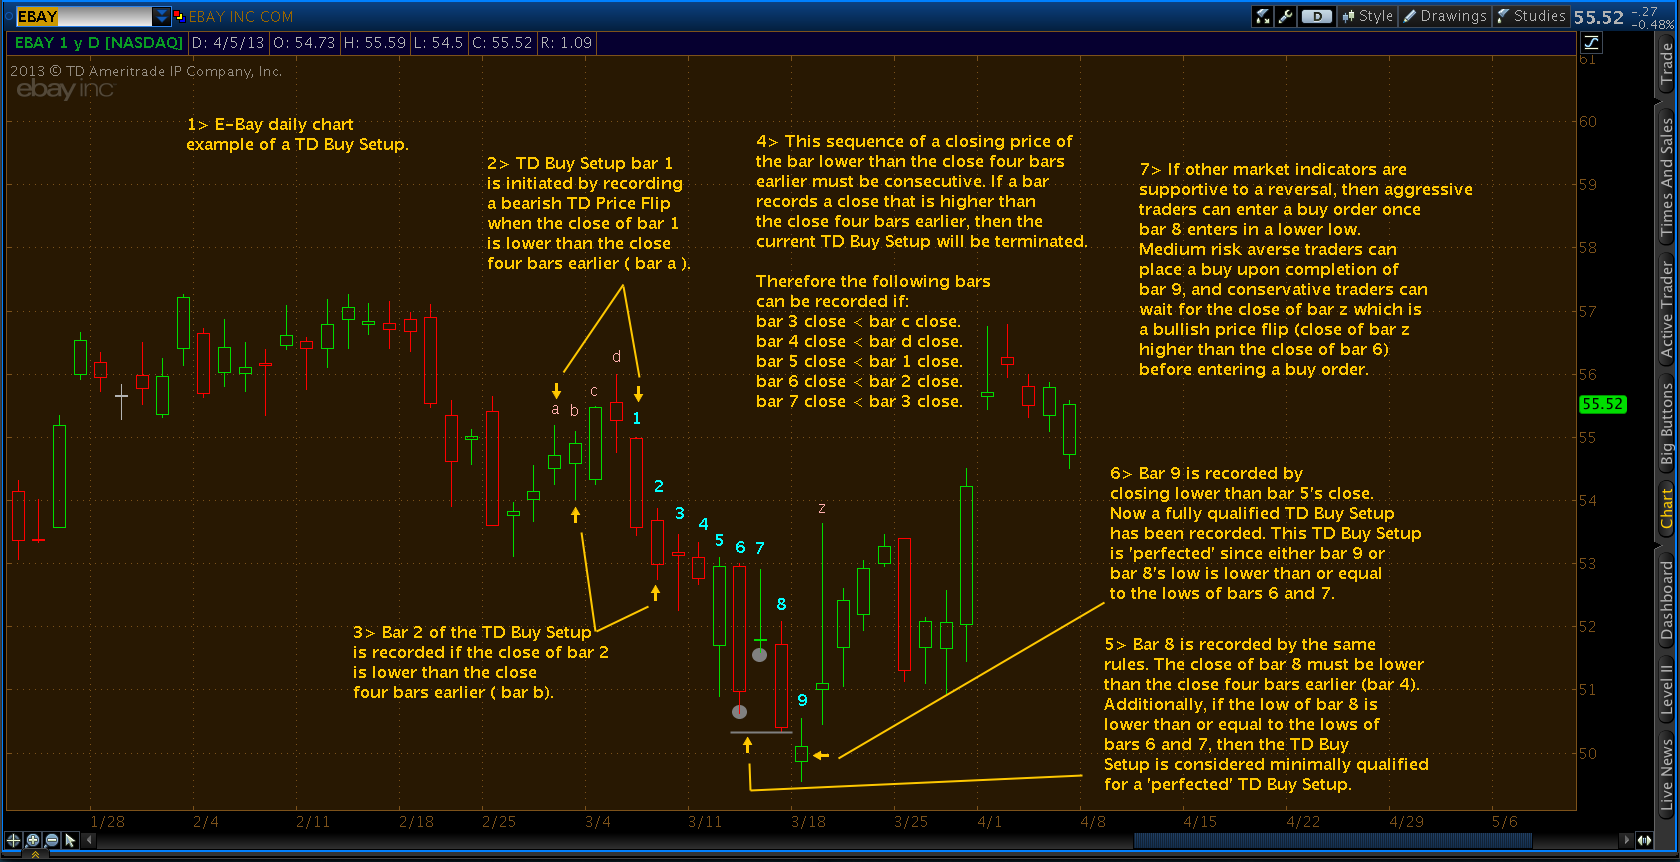
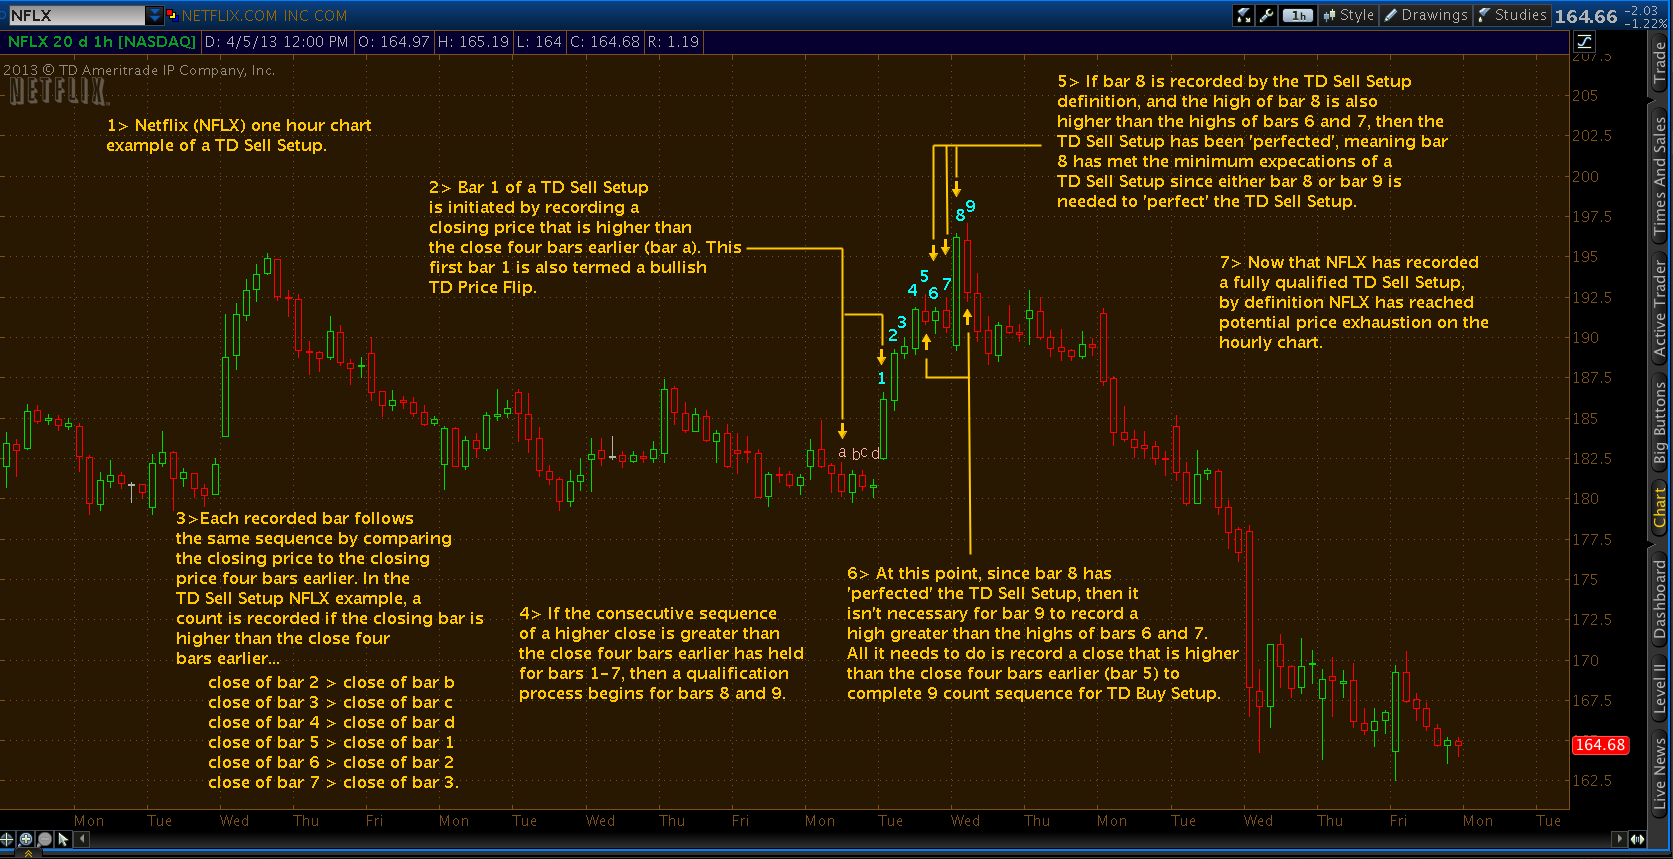
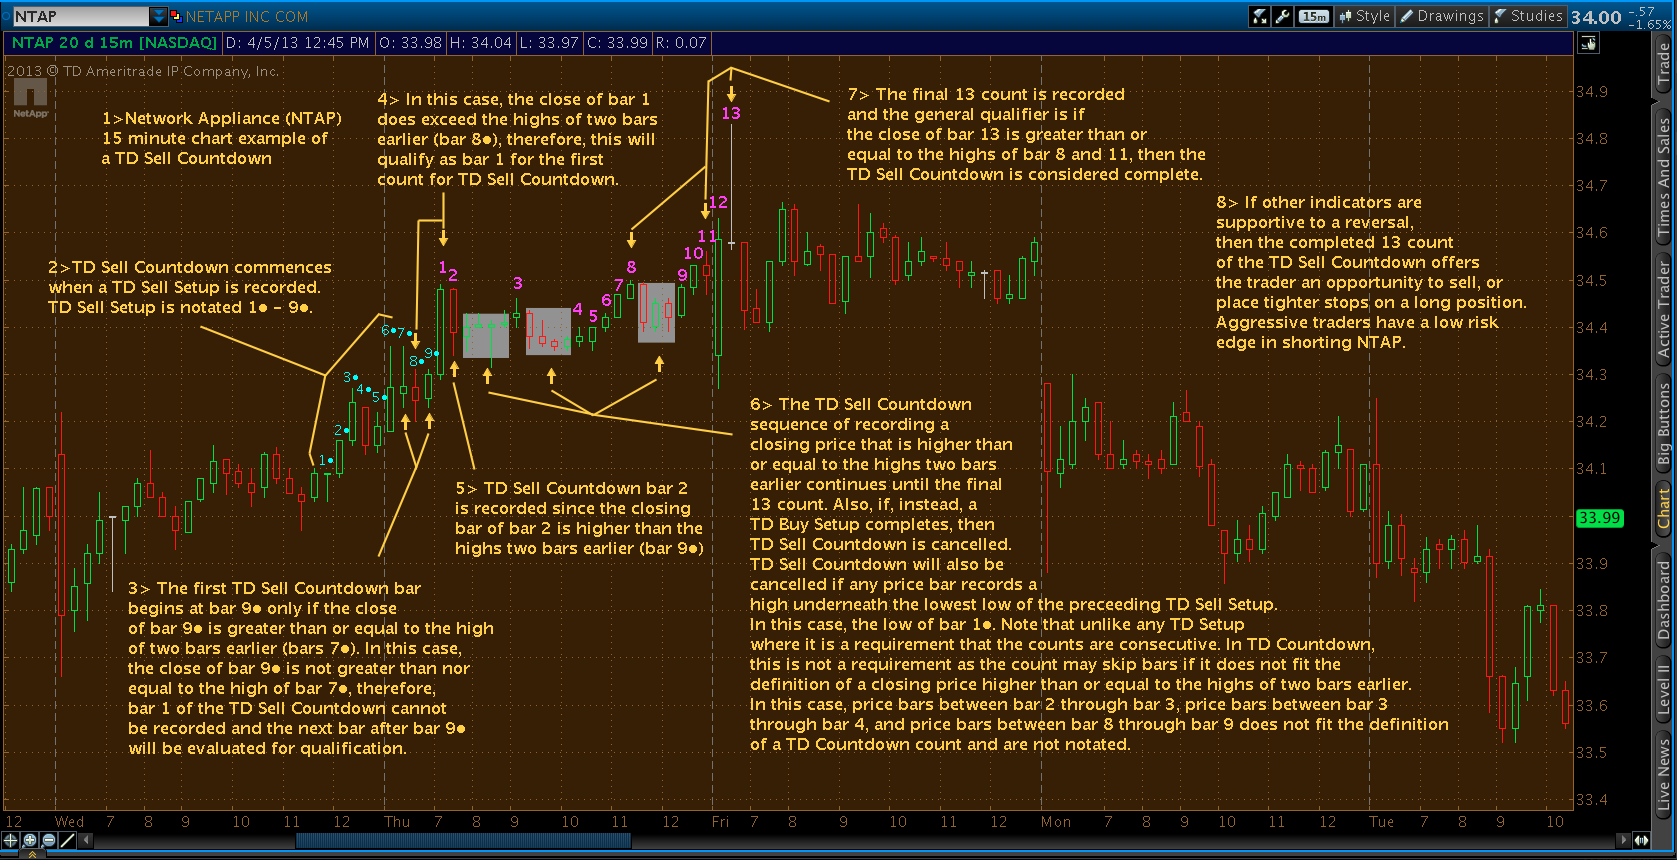
TD Sequential has two parts – TD Setup and TD Countdown. The first phase of TD Sequential starts with a TD Setup and is completed with a 9 count. When the 9 count is completed, it is at that point, a price pause, price pullback, or reversal is likely. It is also at that point where TD Sequential starts the second phase with TD Countdown and is completed with a 13 count. When the 13 count is recorded, it is at that point, a price pause, price pullback, or a reversal is likely.
.
Just 9 and 13. Is it really that simple?

Absolutely not. Other DeMark indicators and other technical analysis indicators should align with TD Sequential’s ability to pinpoint potential reversals. For example, if a leading indicator identifies a condition for a market reversal is likely in the near future, the job of TD Sequential is to provide the “when” for the reversal is likely to take place.
.
What is TD Buy Setup, TD Sell Setup, TD Buy Countdown, and TD Sell Countdown?
TD Buy Setup is the name for a TD Setup when the DeMark counts are recorded as prices are trending lower. Conversely, TD Sell Setup is the name for a TD Setup when the DeMark counts are recorded as prices are trending higher. The same goes for TD Countdown. A TD Buy Countdown is the name for TD Countdown when the DeMark counts are recorded as prices are trending lower and a TD Sell Countdown is the name of TD Countdown when the DeMark counts are trending higher.


Below are four visual examples in describing the components of TD Sequential.
TD Buy Setup for Ebay (EBAY)

The written explanation of each example is numbered in order.


TD Buy Countdown for Zynga (ZNGA)


TD Sell Setup for Netflix (NFLX)


TD Sell Countdown for Network Appliance (NTAP)
 

vagar11

Well-Known Member
#15
Market Wizard Linda Raschke’s Technical Trading Rules


Buy the first pullback after a new high. Sell the first rally after a new low.
Afternoon strength or weakness should have follow through the next day.
The best trading reversals occur in the morning, not the afternoon.
The larger the market gaps, the greater the odds of continuation and a trend.
The way the market trades around the previous day’s high or low is a good indicator of the market’s technical strength or weakness.
The previous day’s high and low are two very important “pivot” points, for this was the definitive point where buyers or sellers came in the day before. Look for the market to either test and reverse off these points, or push through and show signs of continuation.
The last hour often tells the truth about how strong a trend truly is. “Smart” money shows their hand in the last hour, continuing to mark positions in their favor. As long as a market is having consecutive strong closes, look for up-trend to continue. The up trend is most likely to end when there is a morning rally first, followed by a weak close.
High volume on the close implies continuation the next morning in the direction of the last half-hour. In a strongly trending market, look for resumption of the trend in the last hour.
The first hour’s range establishes the framework for the rest of the trading day.
A greater percentage of the day’s range occurs in the first hour then was the case in the past, and thus it has become increasingly important to trade aggressively if there are early signs of a strong trend for the day.
There are four basic principles of price behavior which have held up over time. Confidence that a type of price action is a true principle is what allows a trader to develop a systematic approach. The following four principles can be modeled and quantified and hold true for all time frames, all markets. The majority of patterns or systems that have a demonstrable edge are based on one of these four enduring principles of price behavior. Charles Dow was one of the first to touch on them in his writings.Principle One: A Trend Has a Higher Probability of Continuation than Reversal
Principle Two: Momentum Precedes Price
Principle Three: Trends End in a Climax
Principle Four: The Market Alternates between Range Expansion and Range Contraction!
In the world of money, which is a world shaped by human behavior, nobody has the foggiest notion of what will happen in the future. Mark that word – Nobody! Thus the successful trader does not base moves on what supposedly will happen but reacts instead to what does happen.
 

vagar11

Well-Known Member
#17
By Amit

Regarding Technical Analysis , it is use of fairly simple tools to make investing/trading decisions.After experimenting with a lot of stuff around , I have really found that simple things work very well.

Like a 20 EMA , which I always advocate on daily or even 5 min time frame.
Support/resistances, trend-lines,Fibonacci retracements,etc are the other great tools which can be combined easily with these to form a great system in trading.

I really believe that swing trading or positional trading is simpler compared to Day trading.If you are talking about day trading, it is the toughest and grinding even for the best of the best traders.

Regarding the very basics, I have found that the regular traders visiting this thread are very well versed in Technical Analysis,many of them are very advance levels much higher than me too.
I learn from them.
So it would not be fair to them to start with the very basics.

I recommend a lot of free courses available on the net and trading videos on Youtube.
 
Last edited:

vagar11

Well-Known Member
#18


Amitrandive (i think he resigned from Traderji) used to say that we should always wait for pullback for entry after BO.
I don have the link now but he showed lot of articles/studies which indicates that waiting for pullback saves us from lot of whipsaws. Also the SL is more clearly defined in case of pullback entry.

Novice - Strong breakouts are usually the ones where after the breakout, the next candle barely makes a low into the body of the breakout candle and closes much higher. In your case the candle after the BO candle did not even attempt to takeout the BO candle's high. Thats a warning sign. I would exit my trade right there and wait for another entry.

Vivek - One should exit a breakout trade if a candle closes back within the body high/low of the candle of range it broke out from.
Don't think its (above) a breakout failure, I think its a failed trend reversal (from down to up), I think safer way would be to let a pivot form above the EMA and then go long over that pivot.