


Hi can someone help me to plot the green/red horizontal envelop automatically? I have attached a chart - let me explain:
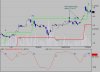
- when stochastic finishes its high (eg. L2 to H3 crossing below the 80% level), plot line HB whose value is the highest HIGH within this period. The next H line will be the highest HIGH of the next cycle from L3 to H4, with a line joining them.
- similarly, when stochastic finishes its low (eg. H2 to L2 crossing above the 80% level), plot line LB whose value is the lowest LOW within this period. The next L line will be the lowest LOW of the next cycle from H3 to L3, with a line joining them.
- both plotted lines will remain at this value until the next cycle initiates a new value, show the values on the right side of the chart if you can.
Many thanks.
Attachments
-
 52.1 KB Views: 141