calculate PREVIOUS DAY HIGH,PREVIOUS DAY LOW
MOST IMPORTANT ON BUY LOGIC :
----------------------------
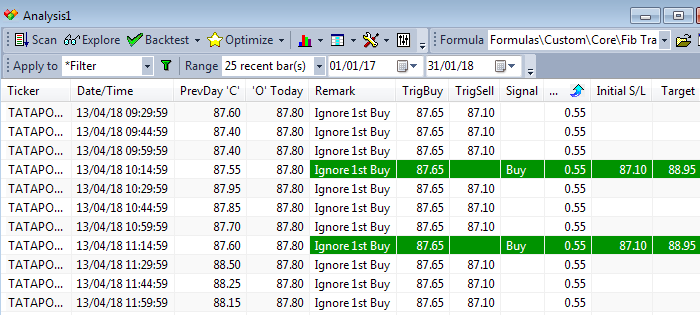
if buy recommended price < previous day's close price....entire day NO BUY..strictly
if day's first candle open price > buy recommended price , then ignore the first buy
BUY trade setup :
---------------
put 2 variables as follows :
CALCULATE " a " = (previous day high - (previous day high-previous day low ) * 0.382
CALCULATE " b " = (previous day high - (previous day high-previous day low ) * 0.618
here, a = buy recommended price , b = stoploss value for the buy entry.
*********a and b values are fixed should not be changed for entire day in buy side ******************
expert advisor must check the important rule :
----------------------------------------------
if a < previous day's close price... entire day no buy
and also
if current day's first candle open price > buy recommended price.. ignore that entry
target price = (previous day's high - previous day's low ) * 0.618 + a
stoploss price = a-b
book at target or exit at stoploss as per logic.
=============================================================================================
VERY IMPORTANT SELL LOGIC :
-----------------------------
if sell recommended price > previous day's close price....entire day NO SELL..strictly
if day's first candle open price < sell recommended price , then ignore the first sell
SELL trade setup :
---------------
put 2 variables as follows :
CALCULATE " a " = (previous day high - previous day low ) * 0.382 + previous day's low
CALCULATE " b " = (previous day high - previous day low ) * 0.618 + previous day's low
here, a = sell recommended price , b = stoploss value for the sell entry.
*********a and b values are fixed should not be changed for entire day in sell side ******************
expert advisor must check the important rule :
----------------------------------------------
if a > previous day's close price... entire day no sell
and also
if current day's first candle open price < sell recommended price.. ignore that entry
target price = (previous day's low - previous day's high ) * 0.618 + a
stoploss price = a-b
book at target or exit at stoploss as per logic.
=============================================================================================
MOST IMPORTANT ON BUY LOGIC :
----------------------------
if buy recommended price < previous day's close price....entire day NO BUY..strictly
if day's first candle open price > buy recommended price , then ignore the first buy
BUY trade setup :
---------------
put 2 variables as follows :
CALCULATE " a " = (previous day high - (previous day high-previous day low ) * 0.382
CALCULATE " b " = (previous day high - (previous day high-previous day low ) * 0.618
here, a = buy recommended price , b = stoploss value for the buy entry.
*********a and b values are fixed should not be changed for entire day in buy side ******************
expert advisor must check the important rule :
----------------------------------------------
if a < previous day's close price... entire day no buy
and also
if current day's first candle open price > buy recommended price.. ignore that entry
target price = (previous day's high - previous day's low ) * 0.618 + a
stoploss price = a-b
book at target or exit at stoploss as per logic.
=============================================================================================
VERY IMPORTANT SELL LOGIC :
-----------------------------
if sell recommended price > previous day's close price....entire day NO SELL..strictly
if day's first candle open price < sell recommended price , then ignore the first sell
SELL trade setup :
---------------
put 2 variables as follows :
CALCULATE " a " = (previous day high - previous day low ) * 0.382 + previous day's low
CALCULATE " b " = (previous day high - previous day low ) * 0.618 + previous day's low
here, a = sell recommended price , b = stoploss value for the sell entry.
*********a and b values are fixed should not be changed for entire day in sell side ******************
expert advisor must check the important rule :
----------------------------------------------
if a > previous day's close price... entire day no sell
and also
if current day's first candle open price < sell recommended price.. ignore that entry
target price = (previous day's low - previous day's high ) * 0.618 + a
stoploss price = a-b
book at target or exit at stoploss as per logic.
=============================================================================================