This material is not written by me. I am only copy pasting from other threads in TJ for reducing Noise. I would prefer if no one comments unless it is really important.
Teach A MAN TO FISH : Saint Sir
Swing Trader : A trader who trades the daily charts, fine tuning his entry using the 60min charts. His trades last 2-5 days.
Position Trader : Nearly equivalent to investing, but nearly can be an important distinction. He trades the weekly charts which means he holds trades from weeks to months.
UPTREND : An uptrend on a chart of any time frame is nothing but a series of higher highs and higher lows.
DOWNTREND: A downtrend on a chart of any time frame is nothing but a series of lower highs and lower lows.
SIDEWAYS TREND : A sideways trend is nothing but relatively equal highs and lows.
UPTREND LINE is nothing but a line that connects two or more LOWS, in a chart in an uptrend. The more points that meet up to this line, the stronger this line is. This trendline acts as support, as prices blast off, then pullback to this line before taking off again. Therefore, in an UPTRENDLINE, the 2nd point is always higher than the 1st point, and the 3rd higher than the 2nd.
DOWNTREND LINE is nothing but a line that connects two or more highs in a downtrend. Once again, the more number of points that connect ,the stronger the line is. This downtrend line acts as resistance. Each down move is followed by a pullback rally to this trendline which acts as resistance only to be met with more selling and lower prices. In DOWNTRENDLINE, the 2nd point is always lower than the 1st, and the 3rd lower than the 2nd.
Note: A break in the UPTRENDLINE signals a possible change in trend. So too with the break in the DOWNTRENDLINE.

we categorise trends into 3 categoriesMAJOR : Simply put,major trends last for greater than 6 months.
INTERMEDIATE: Intermediate trends last between 3 weeks to 6 months.
NEAR TERM TRENDS Near term trends last from a few days to 3weeks.
From a charts perspective, the major trend is seen by looking at the monthly charts. The intermediate trend from the weekly charts, and the near term trend from the daily charts.
What is seen as a downtrend on the daily charts may be nothing but a pullback on the weekly charts, and is not even evident on the monthly charts. What is seen as a downtrend on the weekly charts and a catastrophic crash on the daily may be nothing but a monthly pullback.
The eye can only see what the brain knows. These early days are to be spent in teaching the brain so that the eye sees the pattern from a
mile.
Therefore,in the above example,as each pivot is after a decline, and the pivot is the low after which the stock takes off again, we call them PIVOT LOWS.
Right the opposite in a downtrend. The stock declines from an area and then rallies to an area lower than the first, so on so forth. In this case every pivot is after a rally, and the pivot is that area after which the stock declines further to new lows.
As this pivot tells us of that high after which things go back to its declining ways, we call that a PIVOT HIGH.
So,in an uptrend, we have HIGHER PIVOT LOWS.How did we come to that? Each pivot low is higher than the previous pivot low. Therefore we call it higher pivot lows.
In a downtrend, we have LOWER PIVOT HIGHS. How did we come to that? Each pivot high is lower than the previous pivot high. Therefore we call it lower pivot highs.
In a sideways trend, we have nearly equal pivot highs and lows.
Series of lower pivot highs and lows is called a DOWNTREND.
We have a higher pivot high and a higher pivot low. We are in an UPTREND.
RESISTANCE is that area where selling pressure exceeds buying interest. It is an area where previous rallies get halted and turn down again. It is marked by drawing a horizontal line connecting two or more tops.
Support and Resistance are not absolute points. They are areas. When Support breaks to the downside, we call that a Down Side Breakout or
Breakdown. When Resistance breaks to the upside, we call that a Breakout.
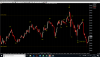
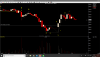
When we get a breakdown below support, that area of support now becomes an area of resistance. Have a look at the JNPR charts below. That area of support broke down and that same area is now acting as Resistance.
A breakout above Resistance, and that same area of resistance now becomes a new Support.

The below is another example.CSCO trading in a tight range. Then we have a breakout above resistance. That area which was previously resistance now becomes Support, as prices use that floor for the next rally.

Yet another example :GOOG(Google )trading on the NASDAQ. Through November to early January, we have higher pivot lows and highs (UPTREND). Then we have that turn around in Mid-Jan. So long as GOOG did not break that previous pivot low of around 422, It was still in an uptrend. Then we have that ugly bar on the daily charts that broke previous pivot lows. Are we in a downtrend now? No. But as far as we are concerned, the uptrend is over. Then we have a rally back to the 450 area in the later part of Jan. This is making a lower pivot high as compared to the previous pivot high. Now are we in a downtrend? Looks more and more likely. But not confirmed as yet. Then that gap down and lower prices taking out the previous pivot low as well. Now we are in a confirmed Downtrend.

A break in an Uptrendline is not a Downtrend. It merely tells us that this uptrend that we have been trading and making profits from is now in question. So too with the Downtrend line. A breakout above the downtrend line does not mean that the stock is now in an uptrend, it merely means that the downtrend is now in question.

Let's make this as simple as we can. We know what an uptrend is, a series of higher pivot highs and lows. Vice versa in a downtrend. Now, for some rules. We only BUY in an uptrend. So long the uptrend is held, we do NOT think of shorting.
The most often repeated line "The trend is your Friend", means we never cross the trend.
The trend is UP, we buy declines.
When the trend is DOWN, we short rallies
Therefore,it is very important to be able to detect the change in trends in the first place. Our minds must work like this.
Look at the charts. Take the weekly charts. Why, the weekly? Because we are looking at intermediate to long term. Are we making higher pivot highs and lows? If the answer is YES, then we are in an UPTREND. And in an UPTREND, we think "BUY DECLINES". That's it!!
If the answer is NO, the previous pivot low just got cracked to the downside ,We are thinking of getting out of our longs in that particular stock or index. Now we are thinking, "SHORT RALLIES" In a downtrend, every rally is a shorting opportunity. In an Uptrend, every decline is a
buying opportunity.
The market changes from Uptrends to Downtrends, again and again. We are not here to predict tops and bottoms. We are not here to anticipate anything. We are here to follow the trend. And as uptrends change to the down, we change from BUYING DECLINES to SHORTING RALLIES.
Originally Posted by rahulg77
Hi Saint,
I have a few questions. When we talk about an uptrend we buy on small corrections. but in a downtrend i did not understand when we say every rally is a shorting opportunity. can u explain the process of shorting. Another question is we see a uptrend on the weekly chart and we enter. now we see a minor correction coming in and we think of buying at declines. But what if that particular downtrend itself ends in a lower pivot low than the previous one. What should our trading strategy be. we will of course have a S/L in place but then it could again go up.
Hope I am clear.
Teach A MAN TO FISH : Saint Sir
What is a Chart?
A chart tells us about the whole play of fear and greed, again and again, all over again. The chart of a particular time frame is therefore a study of fear and greed in the particular company or market in that time frame.Types of Traders
Day Trader : He trades intraday. He buy and sells, shorts and covers within that day. He closes all positions by the end of the day. He takes no risks over night. He basically uses the 5 and 10 min charts for his trading with the 15min and the 60 min charts as backdrop.Swing Trader : A trader who trades the daily charts, fine tuning his entry using the 60min charts. His trades last 2-5 days.
Position Trader : Nearly equivalent to investing, but nearly can be an important distinction. He trades the weekly charts which means he holds trades from weeks to months.
TRENDS
UPTREND : An uptrend on a chart of any time frame is nothing but a series of higher highs and higher lows.
DOWNTREND: A downtrend on a chart of any time frame is nothing but a series of lower highs and lower lows.
SIDEWAYS TREND : A sideways trend is nothing but relatively equal highs and lows.
TRENDLINES :
UPTREND LINE is nothing but a line that connects two or more LOWS, in a chart in an uptrend. The more points that meet up to this line, the stronger this line is. This trendline acts as support, as prices blast off, then pullback to this line before taking off again. Therefore, in an UPTRENDLINE, the 2nd point is always higher than the 1st point, and the 3rd higher than the 2nd.
DOWNTREND LINE is nothing but a line that connects two or more highs in a downtrend. Once again, the more number of points that connect ,the stronger the line is. This downtrend line acts as resistance. Each down move is followed by a pullback rally to this trendline which acts as resistance only to be met with more selling and lower prices. In DOWNTRENDLINE, the 2nd point is always lower than the 1st, and the 3rd lower than the 2nd.
Note: A break in the UPTRENDLINE signals a possible change in trend. So too with the break in the DOWNTRENDLINE.
we categorise trends into 3 categories
INTERMEDIATE: Intermediate trends last between 3 weeks to 6 months.
NEAR TERM TRENDS Near term trends last from a few days to 3weeks.
From a charts perspective, the major trend is seen by looking at the monthly charts. The intermediate trend from the weekly charts, and the near term trend from the daily charts.
What is seen as a downtrend on the daily charts may be nothing but a pullback on the weekly charts, and is not even evident on the monthly charts. What is seen as a downtrend on the weekly charts and a catastrophic crash on the daily may be nothing but a monthly pullback.
The eye can only see what the brain knows. These early days are to be spent in teaching the brain so that the eye sees the pattern from a
mile.
TREND PIVOTS
Higher highs and lows form a rally. Lower highs and lows form a decline. We can have declines in an uptrend. We can have rallies in a downtrend. So now that we know that a series of higher highs is called a RALLY, how then do we define an Uptrend? An UPTREND on a particular time frame is a series of higher pivot highs and lows on that time frame. What then is a downtrend? Nothing but a series of lower pivot highs.
Therefore,in the above example,as each pivot is after a decline, and the pivot is the low after which the stock takes off again, we call them PIVOT LOWS.
Right the opposite in a downtrend. The stock declines from an area and then rallies to an area lower than the first, so on so forth. In this case every pivot is after a rally, and the pivot is that area after which the stock declines further to new lows.
As this pivot tells us of that high after which things go back to its declining ways, we call that a PIVOT HIGH.
So,in an uptrend, we have HIGHER PIVOT LOWS.How did we come to that? Each pivot low is higher than the previous pivot low. Therefore we call it higher pivot lows.
In a downtrend, we have LOWER PIVOT HIGHS. How did we come to that? Each pivot high is lower than the previous pivot high. Therefore we call it lower pivot highs.
In a sideways trend, we have nearly equal pivot highs and lows.
Series of lower pivot highs and lows is called a DOWNTREND.
We have a higher pivot high and a higher pivot low. We are in an UPTREND.
SUPPORT AND RESISTANCE
SUPPORT is that area where buying interest exceeds selling interest, and therefore a previous decline gets halted at this area and turns back up again.It is marked by drawing a horizontal line connecting two or more bottoms.RESISTANCE is that area where selling pressure exceeds buying interest. It is an area where previous rallies get halted and turn down again. It is marked by drawing a horizontal line connecting two or more tops.
Support and Resistance are not absolute points. They are areas. When Support breaks to the downside, we call that a Down Side Breakout or
Breakdown. When Resistance breaks to the upside, we call that a Breakout.
When we get a breakdown below support, that area of support now becomes an area of resistance. Have a look at the JNPR charts below. That area of support broke down and that same area is now acting as Resistance.
A breakout above Resistance, and that same area of resistance now becomes a new Support.
The below is another example.CSCO trading in a tight range. Then we have a breakout above resistance. That area which was previously resistance now becomes Support, as prices use that floor for the next rally.
Yet another example :GOOG(Google )trading on the NASDAQ. Through November to early January, we have higher pivot lows and highs (UPTREND). Then we have that turn around in Mid-Jan. So long as GOOG did not break that previous pivot low of around 422, It was still in an uptrend. Then we have that ugly bar on the daily charts that broke previous pivot lows. Are we in a downtrend now? No. But as far as we are concerned, the uptrend is over. Then we have a rally back to the 450 area in the later part of Jan. This is making a lower pivot high as compared to the previous pivot high. Now are we in a downtrend? Looks more and more likely. But not confirmed as yet. Then that gap down and lower prices taking out the previous pivot low as well. Now we are in a confirmed Downtrend.
A break in an Uptrendline is not a Downtrend. It merely tells us that this uptrend that we have been trading and making profits from is now in question. So too with the Downtrend line. A breakout above the downtrend line does not mean that the stock is now in an uptrend, it merely means that the downtrend is now in question.
TRADING with TRENDS,PIVOTS and SUPP/RES
BUYING DECLINES &SHORTING RALLIES :Let's make this as simple as we can. We know what an uptrend is, a series of higher pivot highs and lows. Vice versa in a downtrend. Now, for some rules. We only BUY in an uptrend. So long the uptrend is held, we do NOT think of shorting.
The most often repeated line "The trend is your Friend", means we never cross the trend.
The trend is UP, we buy declines.
When the trend is DOWN, we short rallies
Therefore,it is very important to be able to detect the change in trends in the first place. Our minds must work like this.
Look at the charts. Take the weekly charts. Why, the weekly? Because we are looking at intermediate to long term. Are we making higher pivot highs and lows? If the answer is YES, then we are in an UPTREND. And in an UPTREND, we think "BUY DECLINES". That's it!!
If the answer is NO, the previous pivot low just got cracked to the downside ,We are thinking of getting out of our longs in that particular stock or index. Now we are thinking, "SHORT RALLIES" In a downtrend, every rally is a shorting opportunity. In an Uptrend, every decline is a
buying opportunity.
The market changes from Uptrends to Downtrends, again and again. We are not here to predict tops and bottoms. We are not here to anticipate anything. We are here to follow the trend. And as uptrends change to the down, we change from BUYING DECLINES to SHORTING RALLIES.
Originally Posted by rahulg77
Hi Saint,
I have a few questions. When we talk about an uptrend we buy on small corrections. but in a downtrend i did not understand when we say every rally is a shorting opportunity. can u explain the process of shorting. Another question is we see a uptrend on the weekly chart and we enter. now we see a minor correction coming in and we think of buying at declines. But what if that particular downtrend itself ends in a lower pivot low than the previous one. What should our trading strategy be. we will of course have a S/L in place but then it could again go up.
Hope I am clear.
Last edited: