Ichimoku Kinko Hyo trading system...!

Status
Not open for further replies.

cnbondre

Well-Known Member
A silly query though... what is " historical price level ". Plz elaborate. Thanks......SM uncle
Hi,

Dear Sibumajumdar,

Chinkou Span-DL is a Delayed, lagging (indicator line :) ) line. It gives us past prices. Hence Lincon Da mentioned it as " historical price level ".

Am I right Lincon Da?

Ah--graph speaks if explained by an expert.:D

Linkon Da thanks a lot for the graph. Now this subject is picking up more interest. I will study and try to digest the information such as how and why you selected the slopping Red and White straight lines, the points to draw the lines I mean, white line for the higher lows of chinkou span understood perfectly, but why price point is taken on Red line to relate it with the past performance only that we need in TA.? Hmmm..

The parallel Green and Red lines in the graph for Chinkou span explains the power of ICHI and one of the use of chinkou span explained very nicely!

Seniors and others please comment on this excellent posting of Linkon Da for the benefit of the members.
Regards,
CNB
 

cnbondre

Well-Known Member
Ichi is a visual tool. not good for scan. If you want to scan for a stock in a good uptrend, scan for stock that has its rsi-21 above 50, adx is above 30 and rising, macd is greater than the signal line. Now observe the stock that the scan throw up in ichi and see if it is trading above the cloud. Then just buy with a stop loss at the kujoun line...
select 5 stocks, 2 might hit sL but the other 3 will give good profit. EOD, you'll be smiling...
Hi,

Linkon Da,

I am a novice in computers and its' languages.
With pure commonsense, trial and error I have tried to write a code (afl) for exploration on the basis of your above in-puts.

Will you please check it for its correctness and suggest modifications if any ?

Hi, tulika,
Hi, Minitrader,

Please help me in this matter. So far you supported me to reach up to this stage.

Comments from other Seniors very much required for the benifit of all

AFL goes like this
--------------------------------------------------------------------------


//-----------EXPLORE-ICHI--for BUY ONLY---------

_SECTION_BEGIN("ADX");
range = Param("Periods", 15, 2, 200, 1 );
Plot( ADX(range), _DEFAULT_NAME(), ParamColor( "ADX color", colorBlue ), ParamStyle("ADX style", styleThick ) );
Plot( PDI(range), "+DI", ParamColor( "+DI color", colorGreen ), ParamStyle("+DI style") );
Plot( MDI(range), "-DI", ParamColor( "-DI color", colorRed ), ParamStyle("-DI style") );
_SECTION_END();

_SECTION_BEGIN("MACD");
r1 = Param( "Fast avg", 12, 2, 200, 1 );
r2 = Param( "Slow avg", 26, 2, 200, 1 );
r3 = Param( "Signal avg", 9, 2, 200, 1 );
Plot( ml = MACD(r1, r2), StrFormat(_SECTION_NAME()+"(%g,%g)", r1, r2), ParamColor("MACD color", colorCustom11 ), ParamStyle("MACD style") );
Plot( sl = Signal(r1,r2,r3), "Signal" + _PARAM_VALUES(), ParamColor("Signal color", colorBlue ), ParamStyle("Signal style") );
Plot( ml-sl, "MACD Histogram", ParamColor("Histogram color", colorBlack ), styleNoTitle | ParamStyle("Histogram style", styleHistogram | styleNoLabel, maskHistogram ) );
_SECTION_END();

_SECTION_BEGIN("RSI");
SetChartOptions(0,0,chartGrid30|chartGrid70);
periods = Param( "Periods", 21, 1, 200, 1 );
Plot( RSI( periods), _DEFAULT_NAME(), ParamColor( "Color", colorYellow ), ParamStyle("Style") );


//--------------EXPLORE-------------------

Buy = ADX(15) > 30 //---condition 1-ADX for 15 period is above 30
AND
ADX(15) > Ref(ADX(15),-1)//-- and ADX is rising
AND
RSI(21)> 50 //--condition 2-RSI for 21 period is above 50
AND
RSI(21) > Ref(RSI(21),-1)//--and RSI is rising
AND
MACD(12,26) > r3 AND MACD(12,26) > Ref(MACD(12,26),-1); /*--condition 3-MACD the difference between 26 period EMA (slow) AND 12 period EMA (fast) is
greater than the Signal line 9 period EMA = MACD(12,26) > r3 AND rising =MACD(12,26) > Ref(MACD(12,26),-1)*/


Filter = Buy;

AddColumn(IIf(Buy,66, 0),"ACTION REQUIRED", formatChar, colorWhite, bkcolor =IIf(Buy, colorGreen,colorDefault));

_SECTION_END();


--------------------------------------------------------------------------
 
Last edited:

linkon7

Well-Known Member
Code:
Buy = 	RSI( 21 ) > 50
	AND ADX( 14 ) > 30
	AND MACD( 12, 26 ) > Signal( 12, 26, 9 );

Sell = 	RSI( 21 ) < 50
	AND ADX( 14 ) > 30
	AND MACD( 12, 26 ) < Signal( 12, 26, 9 );

PlotShapes (Buy*shapeUpTriangle,colorGreen);
PlotShapes (sell*shapeDownTriangle,colorRed);
try this...
 

cnbondre

Well-Known Member
Code:
Buy = 	RSI( 21 ) > 50
	AND ADX( 14 ) > 30
	AND MACD( 12, 26 ) > Signal( 12, 26, 9 );

Sell = 	RSI( 21 ) < 50
	AND ADX( 14 ) > 30
	AND MACD( 12, 26 ) < Signal( 12, 26, 9 );

PlotShapes (Buy*shapeUpTriangle,colorGreen);
PlotShapes (sell*shapeDownTriangle,colorRed);
try this...
Hi,

Linkon Da,

Thanks for your reply

Adding "SELL" made it beutiful and balanced. Now scanning gives better oportunity. It is now more usefull plot and explore afl :D

I do not have on line charting facility. :eek:

Which broker facilitates for Amibroker interface RT feed ? Will you please suggest some name ?:confused:

Thanks and Regards,

CNB
 

vishalalluri

Well-Known Member
hi linkon

i have been going through your thread since yesterday its great and lucid
i am a novice trader and i dun use any softwares which give intra day real time charts

i use chart nexus in which i can only update eod evry evening it has ichimoku as a tool when i have been looking at the charts i could not fine the chikou span line in it
it has only 26d 9d and komu(cloud ) widout the chikou span can we enter into short term position looking at the crossovers and above or below the cloud or should we add any other indicator like adx or rsi which would give more confirmation ..

is taking decisons only with 26d 9d and komu safe???????????/
i will attach the chart of the software i use in some time please go through and see if its okie

thnks in advance

happy weekend
 

vishalalluri

Well-Known Member
hi linkon/linkon sir

Idun know if i shud call linkon sir /linkon cos with ur great experience in markets i feel like putting a sir ahead of ur name .

im posting this chart from the software i use chart nexus and using ichi gmma and adx i see unitech to be bullish enuf if markets don see correction

please correct me if wrong i see positivity with gmma ADX and ichi (9d crossover 26d and on a whole above the kumo ) so can we say that trend is bullish for unitech


i m a learner please help me out :)
 

CamelToeJoe

Well-Known Member
I just found this and I must say it is great! This is an awesome thread and very well written. :thumb:

Nice work man! I've been trading penny stocks since early July '09 and have had great success using Ichimoku. I hope to make the crossover to the FX markets soon. :clap: I have a thread over at hotstockmarket.com

I've noted your thread over there as an awesome reference.

I will be writing more in depth as I have more time.

Let me know what you think...
http://www.hotstockmarket.com/forums/showthread.php?t=71120

Thanks again
-J
 

linkon7

Well-Known Member
hi linkon/linkon sir

Idun know if i shud call linkon sir /linkon cos with ur great experience in markets i feel like putting a sir ahead of ur name .

im posting this chart from the software i use chart nexus and using ichi gmma and adx i see unitech to be bullish enuf if markets don see correction

please correct me if wrong i see positivity with gmma ADX and ichi (9d crossover 26d and on a whole above the kumo ) so can we say that trend is bullish for unitech


i m a learner please help me out :)
Please dont refer me as sir. feel mighty embarrassed by it.
Ichi is a system that looks at the price and only price is the criteria for selection as per that system. The cloud is just informs us where the resistance / support zone is and how strong that zone is.

The 26 / 9 day line gives the mid term and the short term trend. many times, u'll notice, it goes flat. We can use these lines for stoploss and direction and as reference for entry.

I see, u r using guppy for trend reading. That is another of my fav trend indicators. Unitech in definitely in an upternd.
 

linkon7

Well-Known Member
I just found this and I must say it is great! This is an awesome thread and very well written. :thumb:

Nice work man! I've been trading penny stocks since early July '09 and have had great success using Ichimoku. I hope to make the crossover to the FX markets soon. :clap: I have a thread over at hotstockmarket.com

I've noted your thread over there as an awesome reference.

I will be writing more in depth as I have more time.

Let me know what you think...
http://www.hotstockmarket.com/forums/showthread.php?t=71120

Thanks again
-J
Ichi is very popular among FX traders. Maybe, b'cos YEN is a vital currency and Japs use ichi a lot. Hence the popularity.

I read ur post in hotstockmarket. Great work. Please do share your thought in this forum as well...It'll help us a lot...
 

CamelToeJoe

Well-Known Member
I read ur post in hotstockmarket. Great work. Please do share your thought in this forum as well...It'll help us a lot...
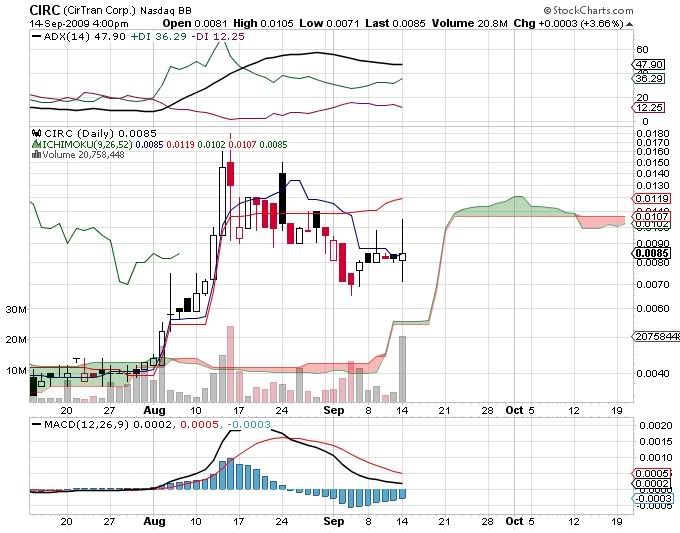
I definitely will but I have a quick question for you first.

Here is the scenario:
-kijun starts to move laterally as tenkan crosses below kijun to meet price action
-As tenkan moves underneath/just above price action for support/resistance, kijun starts to move up while tenkan remains lateral.

My question is what is this telling us and can we expect price action to test kumo resistance soon?

 
Status
Not open for further replies.

Similar threads