


Whole code
Have you ever heard of adding \n or are you a programming noob?
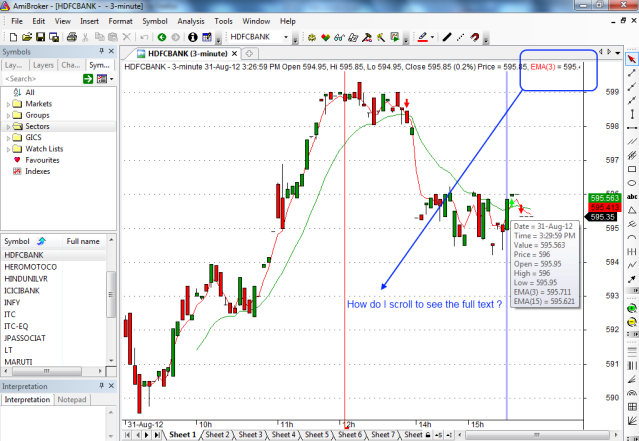
If you are the latter one then I tell you that adding \n causes a line break wherever you want it to be in your text output.
You could add another line break at
Plot(EMA(C,15),"\nEMA(15)", colorGreen );
and so on ...
Code:
_SECTION_BEGIN("AFL Coding");
SetBarFillColor( IIf( Close > Open, colorGreen, colorRed ) );
_N(Title = StrFormat("{{NAME}} - {{INTERVAL}} {{DATE}} Op %g, Hi %g, Lo %g, Close %g (%.1f%%)\n {{VALUES}}", O, H, L, C, SelectedValue( ROC( C, 1 ) ) ));
Plot(C,"", colorBlack, styleCandle );
Plot(EMA(C,3),"EMA(3)", colorRed );
Plot(EMA(C,15),"EMA(15)", colorGreen );
Buy=Cross(EMA(C,3),EMA(C,15));
Sell=Cross(EMA(C,15),EMA(C,3));
Filter = 1;
AddColumn( Close, "Close" );
_SECTION_END();If you are the latter one then I tell you that adding \n causes a line break wherever you want it to be in your text output.
You could add another line break at
Plot(EMA(C,15),"\nEMA(15)", colorGreen );
and so on ...

")
