R
Hi ,
My first attempt at writing an Afl.
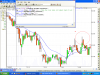
I have tried to write an afl that will show an arrow when the highest high of last 5 bars is crossed and when the lowest low of last 5 bars is crossed.
This is based on 1 minute charts.
The code shows blan, its not plotting.
Where am I going wrong?
Please guide this new programmer")
_SECTION_BEGIN("myfirstafl");
TimeFrameSet (in1Minute );
Buy = High > HHV(Close,-5);
PlotShapes(shapeUpArrow*Buy,colorGreen);
Sell = Low < LLV(Close,-5);
PlotShapes(shapeDownArrow*Sell,colorRed);
Short = Sell;
Cover = Buy;
_SECTION_END();
My first attempt at writing an Afl.
I have tried to write an afl that will show an arrow when the highest high of last 5 bars is crossed and when the lowest low of last 5 bars is crossed.
This is based on 1 minute charts.
The code shows blan, its not plotting.
Where am I going wrong?
Please guide this new programmer
_SECTION_BEGIN("myfirstafl");
TimeFrameSet (in1Minute );
Buy = High > HHV(Close,-5);
PlotShapes(shapeUpArrow*Buy,colorGreen);
Sell = Low < LLV(Close,-5);
PlotShapes(shapeDownArrow*Sell,colorRed);
Short = Sell;
Cover = Buy;
_SECTION_END();