Re: For My Moneycontol friends
http://tinypic.com/r/mjsuqe/8
http://tinypic.com/r/2ms2fq8/8
so the above links of diagrams in which both candles are either equal or atleast 50 percent of there size only they are Bullish engulfing pattern
now we move to second important pattern that is called as
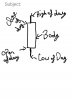
Bearish engulfing Pattern
Bearish engulfing patterns are those in which first we hve a big bullish candle and then the next candle is Big bearish candle or one of the candle should be of atleast 50 percent of there size, Bearish engulfing pattern is strong indication that a particular stock is about to fall from next or after few sessions, now bearish engulfing pattern will only be valid also when a stock of that chart is rising, dnt get confused , i will show u diagrams below this, just remember always that whenever a stock is rising and suddenly u see this pattern which is called as Bearish engulfing pattern then it means stock is about to fall now, so this pattern is v strong sign of bearishness.
the diagrams are as follows
http://tinypic.com/r/2w6icrm/8
http://tinypic.com/r/2co322e/8
http://tinypic.com/r/if9xc1/8
so all the above diagrams of candles u can see clearly which is bearish engulfing pattern and which is not,
now i will teach u about third most important pattern which is called as
Morning star pattern
Morning star pattern is also v important pattern, it indicates a very bullish signal, whenever u see a morning star pattern then immediately after that you will see big buying coming up and trend moves towards buying side, personally in stocks i have seen morning star pattern lot of times and it really works v well for buyers, so it indicates clearly that heavy buying is about to start. in Morning star pattern there are 3 candles, first one is bearish , second one is small tiny candle it cld be either bearish or bullish and the third one os bullish candle
the diagrams are as follows for Morning star pattern
http://tinypic.com/r/2n85ydh/8
now if u see the diagram of morning star pattern u will see all three candles, first one is bearish second one is small candle it can be either bullish or bearish doesnt matter and third one iis bullish, in this pattern the first candle and the last candle they hve to be of same size or atleat more then 70 percent of there size,
now lets move to another pattern which is called as
Evening star pattern
evening star pattern is a signal that a strong fall is about to come in that stock or that particular financial chart, in this pattern also there are 3 candles, first one is bullish, second one is a small candle it cld be either bearish or bullish and the third candle is bearish, the diagram is as follows
http://tinypic.com/r/2gvkl1x/8
u can clearly see that first candle is bullish and second is a small candle and third is bearish , this is evening star pattern where first and last candle has to be of same size or atleast 70 percent or atleast one shld be of 70 percent of there size,
now i will tell u about another v important candle which is called as
shining star or Hammer.
in this candle there is a long tail to the downside and the closing price is always at day highs. this candle indicates a v strong bullish sign for that particular stock ,
the diagram for shining star candle is as follows
http://tinypic.com/r/209q2ab/8
u can clearly see that shining star candle has a long pin to downside, that means that stock went to days lows but closed at days highs , thats a strong indication of buyng signal, pin of shining star candle has to be long enough
now lets move forward to another candle thats calles as
shooting star
shooting star candle is a strong indication of selling, it means that frm next session or in few sessions strong selling is about to come and stock will go down. in this candle the long tail or the long pin of candle has to be on the upside, the diagram is as follows
http://tinypic.com/r/23mr22q/8
u can clearly see in shooting star candle, there is always a long pin to the upside that means stock went to days highs but cldnt sustain and closed at day lows, so its a strong bearish signal
lets move forward and now see another candle thats called as
Doji
now Doji is a candle where the opening price of the stock and the closing price of that stock is same, so whenever Doji get created that means that trend of that stock is about to change, lets say if a stock is rising up frm last 30 sessions and then we see a doji, so thats a signal that trend is about to change now and that stock can fall now, it as same as for falling stock as well, if its fallng and then doji gets created on a particular day then that means trend of fall is about to stop now and a rise is comng soon, the diagram for the doji is as follows
http://tinypic.com/r/9zoxzn/8
now u can see clearly how doji looks lke
movng forward there is one more pattern which is called as bullish harami or bearish harami pattern but personally i saw it lot of times but it never do as it says, so i dnt wnt to teach u about that as a newbie if u call focus on the key and v important patterns which i said here thats v good for u all, rest all u can learn later also
now the most important thing is that all these patterns are only valid when stock is either falling or rising, if a stock is consolidatng then during that consolidatiion u see any of these patterns then they are of no use, they mean nothng, they has to be created only when stock is rising or stock is falling, now all these patterns only get created on hot points or v important levels of that particular stock,
what i mean is where the major action is going on, the major action of buyng and selling only goes on where hot points are, hot points means, where we hve horizontal supports and horizontal resitances or moving averages or some important fibonacci levels but mostly 90 percent of the tme u will see these patterns only near supports or resistance levels or moving avrges.
now i am gonna teach u about Horizontal Supports and reistances tommorow, how to draw them or see them on a particular stock and what are moving averages, we gonna cover all that tmmrw
now someone asked me today on moneycontrol that sir what is correction and what is consolidation
now correction is if a stock is going up frm many days and then suddenly it comes little down , now lets say there is a stock called Mango it was at 50rs 10days ago and then today it is at 75rs, so stock Mango went from 50 to 75 in 10days thats a v good rise and now after 5 days we see the same stock mango is at 65rs, so that is called correction, in this stock rise for 10days and then corrected little for next 5days and then again it starts it upward journey and reach 90rs, so every uptrend stock corrects,
now what is consolidation lets say stock Mango was at 50rs 10days ago and today it reached 55rs and after 10 days we see its at 50 and then after 10days we see its at 45, then after days we see its at 50 again, then after 10days it reach it is at 55 and then we see after 10days and its at 50 again, so what this stock is doing is only movning up and down little bit, if a particular stock remains on a same place or 10rs up or 10rs down for sometme then thats called consolidation,
i was just gvng u all a basic view here how things looks and how to see them but when u will start reading your own charts, u will all learn slowly and start to grasp everythng, maybe first tme it may soung u tough but its not tough ok, u all hve to just focus on what i write here and its important u learn first slowly and sliowly all the basics
tmmrw we gonna start wth support and resistance levels and there meanings and about moving averages and what it is,
if anyone wnt to search in google also all those candles patterns u can see the drawings there aswell,
so till now we all learn about candles and what r important patterns and candles r


 52.4 KB Views: 149
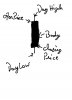 44.1 KB Views: 153
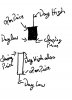 63.9 KB Views: 151
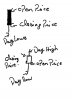 56.3 KB Views: 152