Hi evryone,
I found this code:
I don't know about the code, so I would like to ask for your help: I want to add ROC(C,1) to the Title of the above code, how should I edit it?
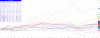
It looks like the picture below

Thank you everyone for reading.
I found this code:
I don't know about the code, so I would like to ask for your help: I want to add ROC(C,1) to the Title of the above code, how should I edit it?
It looks like the picture below
Thank you everyone for reading.
Code:
_SECTION_BEGIN( "watchlist" );
WatchlistName = ParamList( "WatchList", "1 Buys,2 Watch,3 Supertrenders,5 Exchange Rates,6 Indices World,10 Metals Precious,22 Cryptos,23,24" );
category = categoryWatchlist;
listnum = CategoryFind( WatchListName, category );
TickerList = CategoryGetSymbols( category, listnum );
_SECTION_END();

_SECTION_BEGIN( "FontSize" );
fontsize = Param( "Label font size", 7, 4, 10, 1 );
_SECTION_END();

_SECTION_BEGIN( "RelativePerformance" );
fvb = Status( "firstvisiblebar" );

PlotGrid( 0, colorDarkGrey );
_SECTION_END();
Title = "";

mx = Matrix( StrCount( TickerList, "," ) + 1, 3 );

for( i = 0; ( symbol = StrExtract( TickerList, i ) ) != ""; i++ )
{
    fc = Foreign( symbol, "C" );

    if( ! IsNull( fc[ 0 ] ) )
    {
        relP = 100 * ( fc - fc[ fvb ] ) / fc[ fvb ];
        color = colorLightOrange + ( ( 2 * i ) % 15 );
        Plot( relP , "", color, styleLine | styleNoLabel );
        mx[i][0] = i; // index
        mx[i][1] = LastValue( relP ); // performance
        mx[i][2] = color; // color
    }
}

// build buttons
mx = MxSortRows( mx, False, 1 );
x0 = Status( "pxchartleft" );
y0 = 20;
btnWidth = 150;
btnHeight = 25;
x = x0;

for( i = 0; i < StrCount( TickerList, "," ) + 1; i++ )
{
    performance = Nz( mx[i][1] );

    if( NOT performance ) continue;

    symbol = StrExtract( TickerList, mx[i][0] );
    y = y0 + i * btnHeight;
    GuiButton( StrFormat( "%s  %.2f%%", symbol, performance ), i + 1, x, y, btnWidth, btnHeight, notifyMouseEnter );
}

// highlight line with mouse over its respective button
for( n = 0; id = GuiGetEvent( n, 0 ); n++ )
{
    event = GuiGetEvent( n, 1 );

    if( event == notifyMouseEnter )
    {
        i = id - 1;
        symbol = StrExtract( TickerList, mx[i][0] );
        fc = Foreign( symbol, "C" );
        relP = 100 * ( fc - fc[ fvb ] ) / fc[ fvb ];
        color = mx[i][2];
        Plot( relP , "" , color, styleLine, Null, Null, 0, 1, 3 );
    }
}