


Relative strength is a measure of price trend of one stock or index compared to another stock or index. Relative strength is arrived at by dividing one stock by another stock or by one stock by another index, or by one index by another! eg, say x/y is 1.0 for the past many months, and it becomes 0.75 just a week back. What does it mean? Either x has gone down , or y has increased, or some kinda combination of both. See this link: http://www.investopedia.com/ask/answers/06/relativestrength.asp
How does this help? A LT investor can stick to stocks which have a higher ratio, and so does a trader if the same applies in a shorter time span, e.g, I would go long on IT stocks in the near time frame. A trader who is bearish, will look for a smaller ratio, to initiate his shorts.
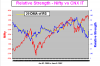
Here we take a look at the CNX IT Index / Nifty. As you can see, the RS is above the 20 period average (Yellow), hinting at a rise in IT stocks in the coming days.
More stock specific examples later.
PS: Don't confuse this and RSI- Relative Strength Indicator which is a different ball game altogether.
ss")
How does this help? A LT investor can stick to stocks which have a higher ratio, and so does a trader if the same applies in a shorter time span, e.g, I would go long on IT stocks in the near time frame. A trader who is bearish, will look for a smaller ratio, to initiate his shorts.
Here we take a look at the CNX IT Index / Nifty. As you can see, the RS is above the 20 period average (Yellow), hinting at a rise in IT stocks in the coming days.
More stock specific examples later.
PS: Don't confuse this and RSI- Relative Strength Indicator which is a different ball game altogether.
ss
Attachments
-
 18.8 KB Views: 145
Last edited: