Check this system :
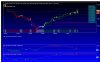
Set your chart to 3 minute time frame.
Set 20 period SMA
Check for HH & HL and LH and LL i.e visual trend (Higher High, Higher Low, Lower High and Lower Low)
If 20 SMA is red, and chart shows Lower Lows and Lower High, sell.
If 20 SMA is green, and chart shows Higher High or Higher Low, buy.
Keep stop loss in mind while trading. Take quick losses and book regular profits - don't let a profit turn to a loss
Besides learning candlestick pattern can help.
First check out the system by paper trading.
Good luck.
I decide to follow your system. :thanx: