Trading under Candle light.

#31
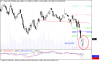
The dragonfly occurs when the open and close are near the top of the candlestick and signals reversal after a down-trend: control has shifted from sellers to buyers.

It is a significant bullish reversal candlestick pattern that mainly occurs at the bottom of downtrends.

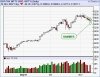
But, I found in starting of an uptrend. Just after the break-out from its resistance level.

Will this means a bullish continuation???

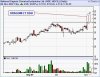
Bad news is that look at the todays volume after this pattern.

Friends what are ur views on this pattern?
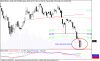
 

Attachments

#32
Hi... I belive there is a "Gravestone Doji" formation today (Nov 6th 2007) in GMR INFRA. I tried attaching the chart but it is not getting attached. Can the seniors please guide us with this chart... Please confirm us, as it will help us in interpreting wht we are learning from this forum and also in this thread

Thanks
 

djsinha

Active Member
#33
Hi... I belive there is a "Gravestone Doji" formation today (Nov 6th 2007) in GMR INFRA. I tried attaching the chart but it is not getting attached. Can the seniors please guide us with this chart... Please confirm us, as it will help us in interpreting wht we are learning from this forum and also in this thread

Thanks
I've attached the chart. I think it's not much a gravestone doji because it has an appreciable candle length. Gravestone dojis on the other hand normally have negligible candle length.

Regarding the significance, it implies that after the start of the market, bulls were ruling the roost but by the end bears gain momentum and take the price below the opening value. Also, from bollinger bands you can see that the scrip is in overpriced range. RSI curve also validates the same. So it's recommended to stay away from it.

Saint please comment on this. After all I'm just a newbie in this arena.
 
Last edited:
#34
I've attached the chart. I think it's not much a gravestone doji because it has an appreciable candle length. Gravestone dojis on the other hand normally have negligible candle length.

Regarding the significance, it implies that after the start of the market, bulls were ruling the roost but by the end bears gain momentum and take the price below the opening value. Also, from bollinger bands you can see that the scrip is in overpriced range. RSI curve also validates the same. So it's recommended to stay away from it.

Saint please comment on this. After all I'm just a newbie in this arena.
Thanks for the reply .....
 

Similar threads