Trading Challenge II : 300% in 5 months

VJAY

Well-Known Member
Dear swagat,
So you totally switched your earlier method which you made from since last 3-4 years knowlege in one go ....:(
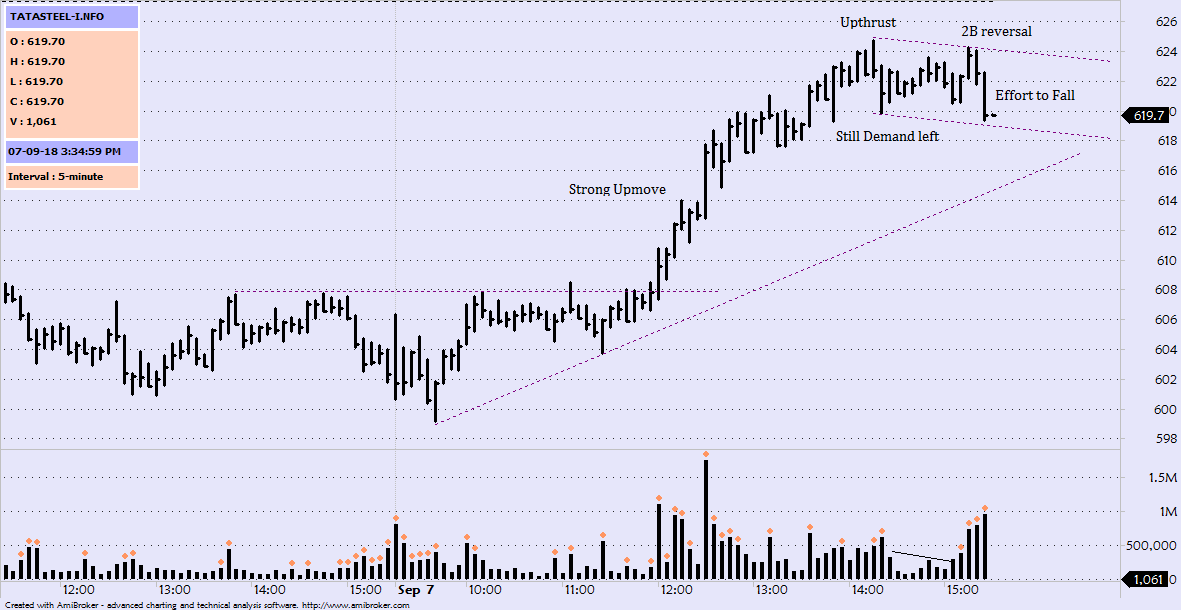
Am again telling you method is need ...buf important is how you apply in our trades....if you look yesterdays tatasteel imo every method catched that move...some method could catched even from bottom...only thing some dif in entry values only....no method is there as holygrail
 
Last edited:

VJAY

Well-Known Member
Hi Swagat,

Have u gone through Decision point trading system by Nifty Nirvana.?
So many people are trading it successfully, the concept is well written with practical examples, u can download it here E-Book.
His Blog link

This i how i read the price action of TATASTEEL equity.
View attachment 28289
He is allready know price actions very well...but he unable to stick with his own method and also put himself with some unnecessary challenges in open forum which make him diaturb his own method....switching method not helps here...he need to workout what he trading and slowly need to overcome negatives of his method....its slow progress...but once trading his method long he would start to feel positives of his method
 

SwagatN

Well-Known Member
Well guys. I have already stated that I never had a well written system before I started my 1st challenge. It was all manual things leading to random actions..it's because of this challenge I have become somehow disciplined and got a direction..I understand not all are going to understand this challenge approach and might consider this unnecessary..but that's okay. Everyone is entitled to have their own view.

Now regarding the change in strategy, yes I had worked hard for last 4 months to build my trend following strategy and even to back test it in long lone hours..but as @VJAY pointed out I lack confidence in it as I have not traded it enough. All we want to know is the dominating side of market so that we can trade in that direction. And the volume spread analysis just showed me the that needed thing. And now I feel confident which was not there before with swing points and trend. Now I can see the cause and it's validated effect in terms of swing / trend/pattern etc.. I don't think every profitable trader today has started their system right from the state it is today..there must be a period of trial and testing before narrowing in the current approach.. it's all about what suits your mindset and psychology most.. then you just need to know that one approach inside out. And I am doing the same.. it's not because I think this stuff is a magic thing and work better than the rest etc etc..

And as I have pointed out yesterday I am ready to dive in deeper and learn it inside out...I am still awaiting an answer from @primitivetrader trader in what he meant when he said volume is not important.. did he mean vs a or some other approach...
 

newtrader101

Well-Known Member
I meant my bullish view is "Not Valid Anymore" around 607.
Ok, as per your condition of price being 2% or above from 21EMA, as the EMA at that point is 601, price should have been atleast above 613.
Or EMA should've been at around 595 when the price is 607. to make 2%.
Here it made only 607/601 = 0.9%
Just trying to understand.
 

Pradeep Narayan

Well-Known Member
Ok, as per your condition of price being 2% or above from 21EMA, as the EMA at that point is 601, price should have been atleast above 613.
Or EMA should've been at around 595 when the price is 607. to make 2%.
Here it made only 607/601 = 0.9%
Just trying to understand.
If you look at the chart (one posted earlier). Price is 2% above 25MA (which is at 606.1), the price is at 619.3.
My interpretation is that the price can correct from this level. You can infer this on 5th Sept when the price reversed from around 581 (that time 25MA was around 595). Also you can see this pattern repeat in Aug 29th and 31st.

Now this anticipated correction is a pullback on an uptrend & it can either turnout to be a deep correction or a new downtrend if the pullback extends beyond 25MA level (606.1). At the time when the chart was posted, I am not sure about this at all.

What I can trade is only based on facts and clear data. At that point in time, the clear inferences are:
a. Stock is in uptrend - as it is well above the longer MA
b. In uptrend, I will enter LONG in pull-backs. I will not short ANTICIPATING a correction.
c. 25MA is my support line & it coincides with the upward sloping trendline (see second chart posted) around 606.5

Given this information, I would keep my STOP (a place where my view that the stock is in up-trend becomes questionable) at 25MA or 607 in future. I would term a 50% pull-back a healthy pull-back in a rally, so my entry would be around 1% below 619 or around 613.
Hope this clarifies.

1536515819564.png
 

SwagatN

Well-Known Member
Date : 10 - sep - 2018


Background = Uptrend on hourly with price being overbought and buying climax followed by a downbar on high volume and weak close. So there is weakness is background,

5m shows upthrust in an uptrend but a low volume test of supply zone with a 2B reversal shows strong supply coming on higher levels. So will be looking for counter trend SHORT.

Primary trade direction remains LONG, Need to see how price behaves when it approaches hourly support zone/oversold zone.
 

SwagatN

Well-Known Member
Price coming down to oversold region on hourly, No strong supply is seen. Downbars are low volume closing off the high. 5m downtrend channel shows strengths near the bottom/oversold zone. Looking for LONG setup here..
 

Similar threads