Tony Crabel's Opening Range Formula

#21
Can we make an exploration for this DryHeat?

So when stock is either moving up to BreakOutLong, or declining to BreakOutShort it will show up in exploration screen. That should be something
That's an interesting idea. So you would use this exploration to periodically scan a pool of stocks? With the idea of focusing on the ones which are nearing the break out level whether short or long?

If this is your intention I would think it best to apply some sort of ranking to each one so you aren't wasting time clicking through the list trying to decide which one to trade.

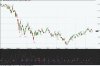
My mind leans toward a conservative approach. One in which you would actually wait for the stock to breakout and buy/sell on the pullback. In this way you could pre-qualify the best candidates by scanning for only those stocks which passed the breakout level on higher than average volume. You would then set your entry point very near the breakout level, waiting to enter as the price pulls back near support. You won't always get a filled order but it seems to me it's the best place to enter with an extremely tight stop loss on the other side of the breakout.

Check out the attached image below for a perfect example of this in today's E-mini 15 minute chart.

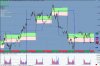
To play a slightly more aggressive trade you may consider scaling in such that you would enter 1/3 at the close of the breakout bar, 1/3 more at the pullback to support, and the final 1/3 as prices pushed back through the close of the breakout bar.

After this all that is required is to determine your exit points. Using the 10 day average of the Maximum H-O vs. O-L should give a very nice profit target.

Ok, sound like a sound strategy? This should be pretty simple to code. But I have to work all week so I wont be able to get this completed until the weekend. It will give me time to study up and understand how best to apply this technique.

Good Trading.

Dry :)
 

Attachments

#22
This sounds good, make an exploration for stocks that has made a breakout with higher volume then average. Thats a good filter for reducing the stocks that will come up in the exploration.

Put a long or short order and waiting for pullback. Will you use the 10 day moving average as a stoploss level?

Thanks for your effort for improving this strategy!
 
#23
_SECTION_BEGIN("");

btime = Param ( "breakout Time", 095500, 095500, 160000, 500 );
breakout = Cross(TimeNum(),btime);

NewDay = Day()!= Ref(Day(), -1);
HDay = HighestSince(newday,H,1);
Lday =LowestSince(newday,L,1);
BHigh = ValueWhen(breakout,hday,1);
BLow = ValueWhen(breakout,lday,1);
Avg=(bhigh-blow)/2;

Plot(C,"",colorYellow,styleBar);
Plot(BHigh,"RESISTENCE",colorGreen,styleNoLine|sty leDots+styleThick);
Plot(BLow,"SUPPORT",colorRed,styleNoLine|styleDots +styleThick);
Plot(BHigh+Avg,"RESISTENCE",colorGreen,32);
Plot(BLow-Avg,"SUPPORT",colorRed,32);

Title = EncodeColor(colorWhite)+ "break out" + " - " + Name() + " - " + EncodeColor(colorRed)+ Interval(2) + EncodeColor(colorWhite) +
" - " + Date() +" - "+"\n" +EncodeColor(colorYellow) +"Op-"+O+" "+"Hi-"+H+" "+"Lo-"+L+" "+
"Cl-"+C+" "+ "Vol= "+ WriteVal(V)+"\n"+
WriteIf(Avg, "Avg."+(Avg)+"","");

this AFL seems very good. on which timeframe this afl should be used for good results ? 5min,15min,30min or 60 min ?
 
#25
This has been quite a journey. I was so intrigued by the concept of the open range breakout that I decided to acquire a copy of Toby Crabel's book on the topic. I have spent the entire 3 day weekend reading, absorbing and then coding some of Crabel's more prominent pricing patterns. My intention was to build a tool for further study to help me fully incorporate Crabel's market concepts.

If you are new to this thread please check back to page two where I provided a screen shot showing an essential setting in order to make sure they code works as designed.

Sorry, Bollis. I have not gotten around to writing an exploration for any of these price patterns yet. Until I understand how they work I really have no place to start. Perhaps in another week or two I may acquire enough insight to attempt an exploration for one or more price patterns.

I have attached two price charts and three associated afl files.
The first chart shows SPY on an EOD database set to show daily bars. The PVT and PVB you see are 2 day swing pivots. The chart is generated by:
Swing Pivots.txt
The black panel under this daily chart is the pallet I used to initially code the various Crabel price patterns. I trust you will find the comments embedded within the code sufficient to explain what each symbol stands for. The panel is generated by:
TB Pattern Panel.txt
The second chart is a 15 minute intra-day chart and incorporates all but two of the price patterns available in the black panel. In order to prevent confusing the breakout levels from the pivot levels I decided to use the styleCloud technique in the plot statement. The green and pink break out levels are separated by the Daily open. Prices trading outside of the green/pink areas during market hours can be considered a breakout. The earlier the breakout occurs the better. Late day breakouts are suspect. The breakout and pivot levels can be turned on and off through the parameters window. The green and red dashes at the bottom indicate market hours (green) and non-market hours (red). I have taken great care to make this formula flexible for multiple time frames. However, only the following time frames are supported:
3, 5, 7, 10, 15, and 30.
Much of my time has been spent wrangling over correct methods to calculate O,H,L,C arrays for only market hours within an intra-day environment. This code may lack robustness to operate in all markets and time frames. I don't assume to know how many different ways the code will be used so if you run into issues I would like to know the specifics as this will add to my market knowledge.
The second chart is generated by:
Intra_TobyCrabel.txt
Attachment removed. For current version please Click Here
Well, I am looking forward to studying the markets using this tool and increasing my understanding of market dynamics. My hope is that you also find this an educational tool.

Dry :) SPY Crable Dly Panel.jpg
 

Attachments

Last edited:
#26
Maximum Average Range
Notice: Then contents of this post are intended to be purely educational in nature. Trade at your own risk. Nothing in this post is intended to guarantee profits or losses of any size. Past results are not indicative of future performance. Consult your registered financial planner before applying any of these techniques to your live trading account.

If the minimum average range over the past 10 days works well as the opening range breakout than it stands to reason the maximum average range over the past 10 days should work well as a profit target. So I plotted the Max Avg Range as a gold colored dotted line. Spot checking over the period from 3/6/09 through 4/6/09 it appears to be a very profitable setup to place a buy limit order at the opening range break to the long side with a protective stop at the open and a limit order to take profits at the gold dotted line. The same would be done for the breakout line to the short side. You would need to use an OCO bracket order so the protective stops at the open for both shorts and longs do not conflict with one another; the goal being to not activate the stop loss order until you are actually in a long or short sided trade. This enables you to stop out and reverse if the market turns against your first trade. Many days in the sample period proved to be profitable in just such a scenario.
In the example below we have the following stats for the opening range:
Long Target: 829.0
Long Breakout: 812.75
Open: 808.25
Short Breakout: 803.75
Short Target: 787.50

So within the first 5 minutes after the open I place the following theoretical orders:
One Cancels the Other (OCO)
For the long side
Parent order: Buy Stop 3 @ 812.75
Child Orders:
Sell Stop 3 @ 808.25
Sell Limit 3 @ 829.00

For the short side
Parent order: Sell Stop 3 @ 803.75
Child Orders:
Buy Stop 3 @ 808.25
Buy Limit 3 @ 787.50

Once the orders are in placed I can simply walk away and go about my business.
Notice within the first hour of trade price moves above the long side breakout, triggering the long side OCO orders. The profit target is never hit, price begins to reverse and the long side order gets stopped out at 808.25 for a theoretical loss of 4.5 points. As prices continue lower the short side order gets triggered. Now we have another setup ready to take advantage of the reversal. Sure enough prices continue downward, finally hitting the short profit target at 787.50 for a theoretical profit of 16.25 points. Theoretical profit for the day is 11.75 points at 3 contracts for a theoretical gross profit of $587.50 excluding commission and slippage.

Advanced Setup. Notice in the chart below the breakout to the long side did make it to the mid point between the buy price and target price. If you can monitor your orders during the day you can maximize this setup by taking out 1 contract at the mid point and moving your stop loss to break even. In this case your long side would have grossed 8 points of theoretical profit for one contract and stopped out at break even for the other two. Then on the short side you would have taken out one contract at 8 points theoretical profit, moved the stop to break even and then collected another 16.25 theoretical points on the final two contracts. Lets see, that would be 8+8+(16.25*2) = 48.5 total theoretical points @ $50.00 per point gives a theoretical profit for the day of $2,425.00 excluding commissions and slippage.

In the interest of learning more about Toby Crabels price patterns I would really appreciate hearing from all of you about other methods you have considered.

Updated .txt file below contains the gold dotted target lines.
Attachment removed. For the current version please Click Here
Dry :)
 

Attachments

Last edited:
#27
Hi,
I use an excel file to calculate the strech value , Long entry and short entry levels. I also use Metastock charting package. Does anybody have the code for Metastock on this ORB trading style.(open range Breakout) . Based on my experience this works well. However, I learnt a valauble tip of using the max range for setting teh targets. Thanks a ton.....

Sri
 

Similar threads