Thoughts on Day/Swing Trading

Status
Not open for further replies.
#81
Re: How To - -

Nbolar,

Sorry to butt in, but I assume that the purpose of the post was to explain the concept of Risk Riward and not the trade entry.
Just like, there exists many variations about keeping Stop Loss, similarly there exists many variations about trade entry also.
Just my opinion.
Yes S-1585.......very true...:)

Smart_trade
 

CASPER

Well-Known Member
#82
Nbolar,
Sorry to butt in, but I assume that the purpose of the post was to explain the concept of Risk Riward and not the trade entry.
Just like, there exists many variations about keeping Stop Loss, similarly there exists many variations about trade entry also.
Just my opinion.
Nithin,

I picked up this chart from a post of S-1585 where he had asked a question of where to keep stoploss once we go short on the breakdown of lower boundry line of rectangle.....
..................
..................
..................
Smart_trade

S-1585...,

I agree with you ( Highlighted sentences in your post...)..., Since ST had explained how Different traders will trade the chart differently i.e TRADER A,B and C .

I was just curious to know from ST if My reading ( Rather i may call it Trying to Read...) the chart to Short was correct or Not !!! ..

I have got My answer Thank You ST ...

Nithin.
 
#83
Dear ST sir

as per this attached nifty chart my trades are as below

bought at 5580 with SL at 5568 with a risk of 12 pts
then added at 5586 with new SL at 5575 now the avg cost is 5583 and new SL is 5575 and the new risk is 8 pts

then added one more lot at 5610 with SL at 5598 and now the avg cost is 5596.50 and the SL is 5598 and sealed profit is 1.5 pts

nifty moved up, upto 5623. but reversed back to hit my SL at 5598 and i got my profits came down and managed to exit at cost. is it correct?

or should i have booked at 5620 levels where i would have got 3*23 = 69 pts. but on what logic?

can u pls correct me.

i normally do it as below.

go long at 5580 with stop of 5568 - 2 lots. risk is 12 pts per lot. and book 1 lot at 1:3 RR ie 5580 + 36 pts = 5616 and second lot trailing SL.
---------------------
kanna
 

Attachments

S-1585

Active Member
#84
Dear ST sir

as per this attached nifty chart my trades are as below

bought at 5580 with SL at 5568 with a risk of 12 pts
then added at 5586 with new SL at 5575 now the avg cost is 5583 and new SL is 5575 and the new risk is 8 pts

then added one more lot at 5610 with SL at 5598 and now the avg cost is 5596.50 and the SL is 5598 and sealed profit is 1.5 pts

nifty moved up, upto 5623. but reversed back to hit my SL at 5598 and i got my profits came down and managed to exit at cost. is it correct?

or should i have booked at 5620 levels where i would have got 3*23 = 69 pts. but on what logic?

can u pls correct me.

i normally do it as below.

go long at 5580 with stop of 5568 - 2 lots. risk is 12 pts per lot. and book 1 lot at 1:3 RR ie 5580 + 36 pts = 5616 and second lot trailing SL.
---------------------
kanna
hey v2kindia,

ST sir will surely answer your question.
But just my opinion. just google out the benefits of scale in/out, no scale in/out.
Then assuming that you have 2 methods for profit booking/Trailing SL etc. and they result in the same profit by end of week, e.g. points earned look like

Method 1: 0, -10, -20, 10, 100 = 80
Method 2: 30, -30, 30, 0, 50 = 80

Now relate yourself to what you would prefer and adapt accordingly.
 
#85
Dear ST sir

as per this attached nifty chart my trades are as below

bought at 5580 with SL at 5568 with a risk of 12 pts
then added at 5586 with new SL at 5575 now the avg cost is 5583 and new SL is 5575 and the new risk is 8 pts

then added one more lot at 5610 with SL at 5598 and now the avg cost is 5596.50 and the SL is 5598 and sealed profit is 1.5 pts

nifty moved up, upto 5623. but reversed back to hit my SL at 5598 and i got my profits came down and managed to exit at cost. is it correct?

or should i have booked at 5620 levels where i would have got 3*23 = 69 pts. but on what logic?

can u pls correct me.

i normally do it as below.

go long at 5580 with stop of 5568 - 2 lots. risk is 12 pts per lot. and book 1 lot at 1:3 RR ie 5580 + 36 pts = 5616 and second lot trailing SL.
---------------------
kanna
kanna,

I find that your entries and adds were very good but the final profit taking needs improvement. Remember that in day trading when large profit accumalates, you have to strike a delicate balance of letting it run and grabbing it. In daytrading your mindset is of a predator.....grab the prey, let it not escape .....

When the market goes up vertical, you have to book the profits without giving too much space to the market to backtrack because your profits will evaporate....I would book 50 % of my profits on a small red bar after the strong verticle green bar shown in your chart. Then we had a small green bar after the red bar....I will book balance 50% once the low of the smallish green bar is cracked......This tightening to be done only in case of vertical moves and we want to grab the profits.....we are open to letting it run further but we wont allow too much space now.....so dont wait till your stops are hit....that will give back too much to the market......

Smart_trade
 

anuragmunjal

Well-Known Member
#86
[QUOTE=Smart_trade;531188]kanna,

I find that your entries and adds were very good but the final profit taking needs improvement. Remember that in day trading when large profit accumalates, you have to strike a delicate balance of letting it run and grabbing it. In daytrading your mindset is of a predator.....grab the prey, let it not escape .....

When the market goes up vertical, you have to book the profits without giving too much space to the market to backtrack because your profits will evaporate....I would book 50 % of my profits on a small red bar after the strong verticle green bar shown in your chart. Then we had a small green bar after the red bar....I will book balance 50% once the low of the smallish green bar is cracked......This tightening to be done only in case of vertical moves and we want to grab the profits.....we are open to letting it run further but we wont allow too much space now.....so dont wait till your stops are hit....that will give back too much to the market......

Smart_trade[/QUOTE]


hi ST
one small doubt here, ( hope I do not pester u too much with my 'small doubts'):)
would the case not be the same at around 5610.. there were 3 vertical green bars even there...

regards
 
#87
[QUOTE=Smart_trade;531188]kanna,

I find that your entries and adds were very good but the final profit taking needs improvement. Remember that in day trading when large profit accumalates, you have to strike a delicate balance of letting it run and grabbing it. In daytrading your mindset is of a predator.....grab the prey, let it not escape .....

When the market goes up vertical, you have to book the profits without giving too much space to the market to backtrack because your profits will evaporate....I would book 50 % of my profits on a small red bar after the strong verticle green bar shown in your chart. Then we had a small green bar after the red bar....I will book balance 50% once the low of the smallish green bar is cracked......This tightening to be done only in case of vertical moves and we want to grab the profits.....we are open to letting it run further but we wont allow too much space now.....so dont wait till your stops are hit....that will give back too much to the market......

Smart_trade


hi ST
one small doubt here, ( hope I do not pester u too much with my 'small doubts'):)
would the case not be the same at around 5610.. there were 3 vertical green bars even there...

regards[/QUOTE]

Yes Anurag....we can book profits around 5610 as it not only has 3 vertical steep bars but the market is at previous resistance....once after the small dip when market takes out a pivot high around 5610, we can enter another initial position and finally book the profits as mentioned in my post.

Look at the top green bar around 5620....it is a very large bar.....probably it will have a very large volumes too , it opens at the lower end of the bar and closes at the top.....it is this candle which generally is a climax candle....all buyers have bought and short sellers capitulate and there is no one left to buy......and market comes down ....

Don't hesitate in asking any doubt...all doubts most welcome as these doubts give me an opportunity to look at things differently and think whether there is a better way and improve in the way I would trade ...so it helps me too....

Smart_trade
 
#89


They say that trend is your friend but that statement needs a qualification that it is your friend as long as it is not about to end.......how does one know that the trend is strong ?

I use following critaria to judge how strong the trend is...and when it is about to give explosive move. The technique I follow is based on Trends knowledge from William McLaren and also from Saint....All credit to them, I just apply that knowledge to the markets....

See those magenta colour lines on the chart ? Those are the lines showing gaps in the earlier top and the reaction bottom after breaking the tops....these gaps show that the trend is strong and about to blow off.. .... After such gaps the trend accelerates.....you can see that on any chart, any time frame......if coupled with other techniques, it gives great confidence to hold the positions, add and wait till the trend is about to end.....

Smart_trade
__________________
 
#90
Smart_Trade Sir thanks for this.

In trend everyone can profit.

But in sideways market we get killed. Why don't you show charts before this phase and show us how you are judging and dealing with this. That will help a lot and will be more helpful sir. Not that this is not helpful. It is. But phase before this keeps small traders like me away and hence we miss this phase.

Phase before this will really help.

Adi


Adi,

Trending and sideways phases are cyclic in any market and after a trending phase expect a sideways phase and after a sideways phase expect a trending phase.....if there is anything certain in the markets ...it is this.

Traders make money in trending phase and give it back in the sideways phase....sometimes they loose more in sideways phase. Every trader has to understand how he is going to negotiate the sideways phase so that he makes some money in it or at least preserve what he has made in a trend and again ride the trend when the market starts trending again...

Traders handle sideways phase in different ways depending on what he is comfortable with ...various ways of handling sideways phase are as under :

1) If you are a range trader, trade the extremes of sideways range....buy near the bottom of the range and sell near the top....

2) Decrease your volumes in sideways phase and increase back to normal volumes when trend starts.

3) Trade on sideways market indicators, oscillators, Bollinger bands extremes etc

4) Totally stay away in sideways phase and trade only trending phases....

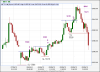
How do we know that we are in sideways markets ? The charts will indicate that. I have taken an example of Nifty Futures 5 min chart.....we had a nice downtrend till point A , then we had an upmove upto point B.....the first indication of sideways market came when at point C market was unable to take out point B...then D,E,F,G all sideways moves till we get a breakdown of the range.....

So in this range either trade the extremes or just stay out and dont loose your capital and energy trading sideways markets......get on to trends when they start again.....

Smart_trade
 
Status
Not open for further replies.

Similar threads