


Thomas DeMark Sequential System
- Thread starter leo_3455
- Start date
Comparison is always done when the candle is complete and not when it is being formed.
Now taking example of daily candles, after today's candle is formed, at end of the day we number that candle as candle 0, then previous candle as candle -1, then precious to candle -1 as candle -2 , then candle -3 and -4 so we compare closing price if candle 0 with candle-4 to see whether that day qualifies for a set up day in the sequence of 9 consecutive days or not.
Smart_trade
My concern was that only, it should be candle no. 'zero' or 'one' and you will appreciate that this counting if wrongly done will change the whole game.so a big thank you for having started my 'gaddi' which was stand still due to this..
TX
Re: Apollo Tyres
Apollo Tyres made a high of 121.85 on NSE today . The move has achieved its target as expected.This target was looking too ambitious initially.
Smart_trade
After 9 set up bars, we have intersection on 9th bar and we have completed 3 countdown bars. Lot of upmove still looks possible . My target looking at the chart is about 120-125
Smart_trade
Smart_trade
Smart_trade
The chances of downmove are more as we have cracked a TDST support line so most probably we will complete sequential 13 buy countdown bars.
Having said the above, markets short term trend has changed to up from yesterday so we should be trading from long side till the trend reverses.
ST
Having said the above, markets short term trend has changed to up from yesterday so we should be trading from long side till the trend reverses.
ST
BTW, today we got 1st candle of 13 buy countdown bars.
Re: Apollo Tyres
Hello ST sir,
Can you explain more on this?
I always wonder about this ,
,
Does it means it broker TDST resistance and 13 countdown bar started out of which 3 completed as you said ?
After 9 set up bars, we have intersection on 9th bar and we have completed 3 countdown bars. Lot of upmove still looks possible . My target looking at the chart is about 120-125
Smart_trade
Smart_trade
Can you explain more on this?
I always wonder about this
, Does it means it broker TDST resistance and 13 countdown bar started out of which 3 completed as you said ?
NIFTY INTRA DAY
13 Feb
Disclaimer : These notes/comments have been prepared solely to educate those who are interested in the useful application of Technical Analysis. While due care has been taken in preparing these notes/comments, no responsibility can be or is assumed for any consequences resulting out of acting on them.Trading in Stocks/Commodities/Futures Carry Risk.Consult your financial advisor only before you trade.
CNX NIFTY 6,001.10 -82.90 -1.36 %
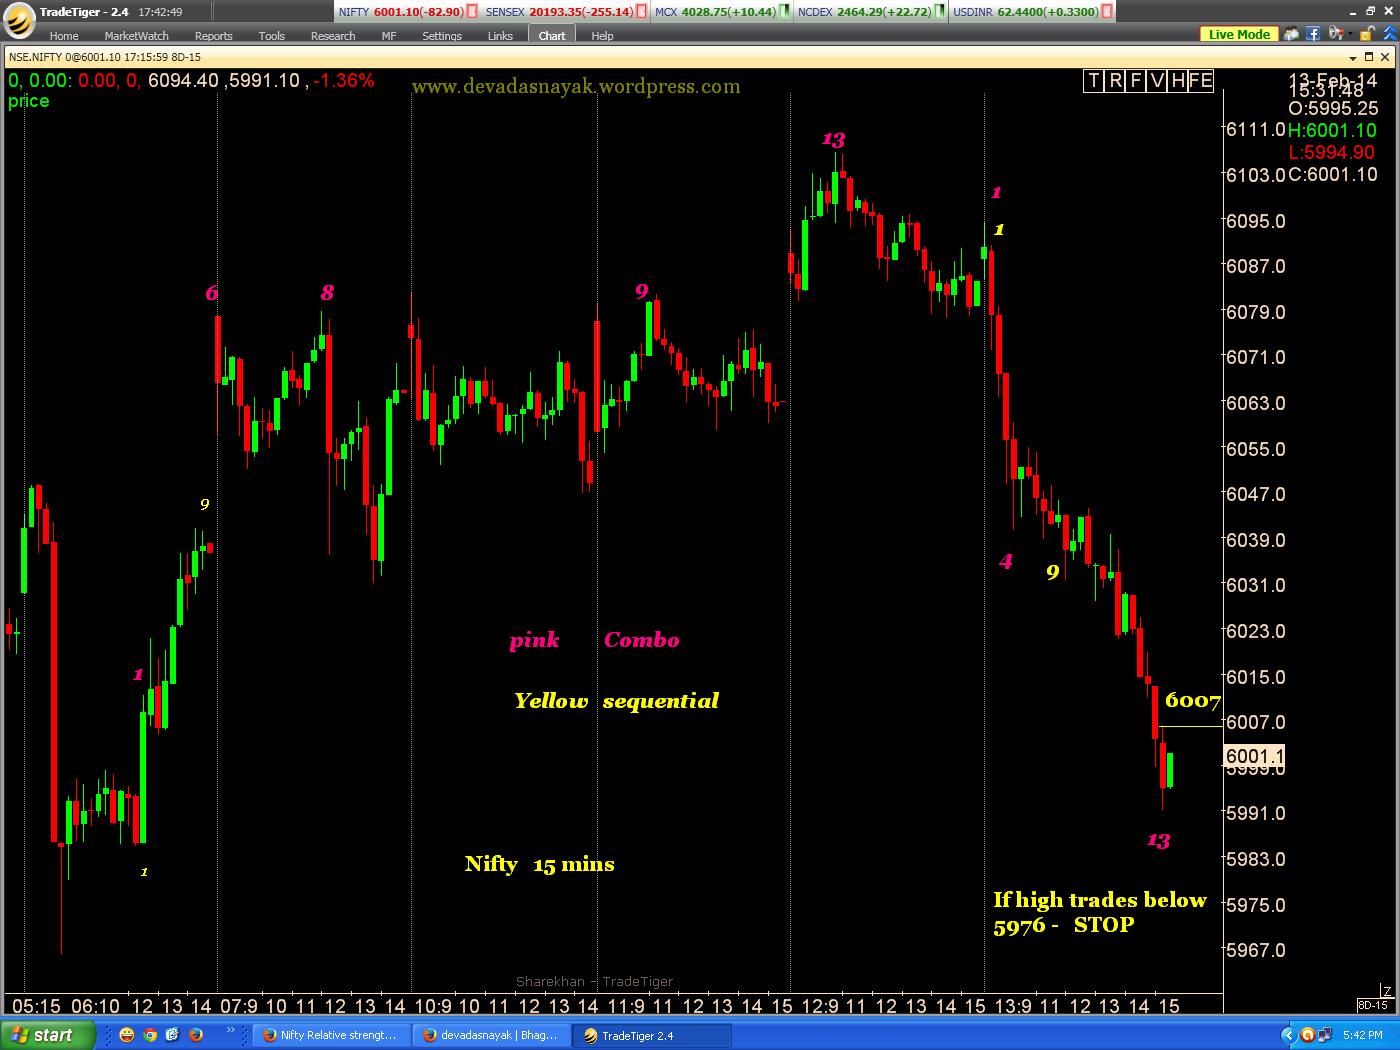
Nifty 15 min chart is depicted below.It has completed a TD Combo 13sell signal on 15 minute chart, which was the reason of fall today.Also it has completed a buy setup and TD Combo buy.One can go long above 6007, provided the high of 15 minute bar is not below 5976.(Warning : I am discussing about 15 min bar / candle and not daily high / low One should use Live charts while trading these setups).Also this is only for intra day trading.
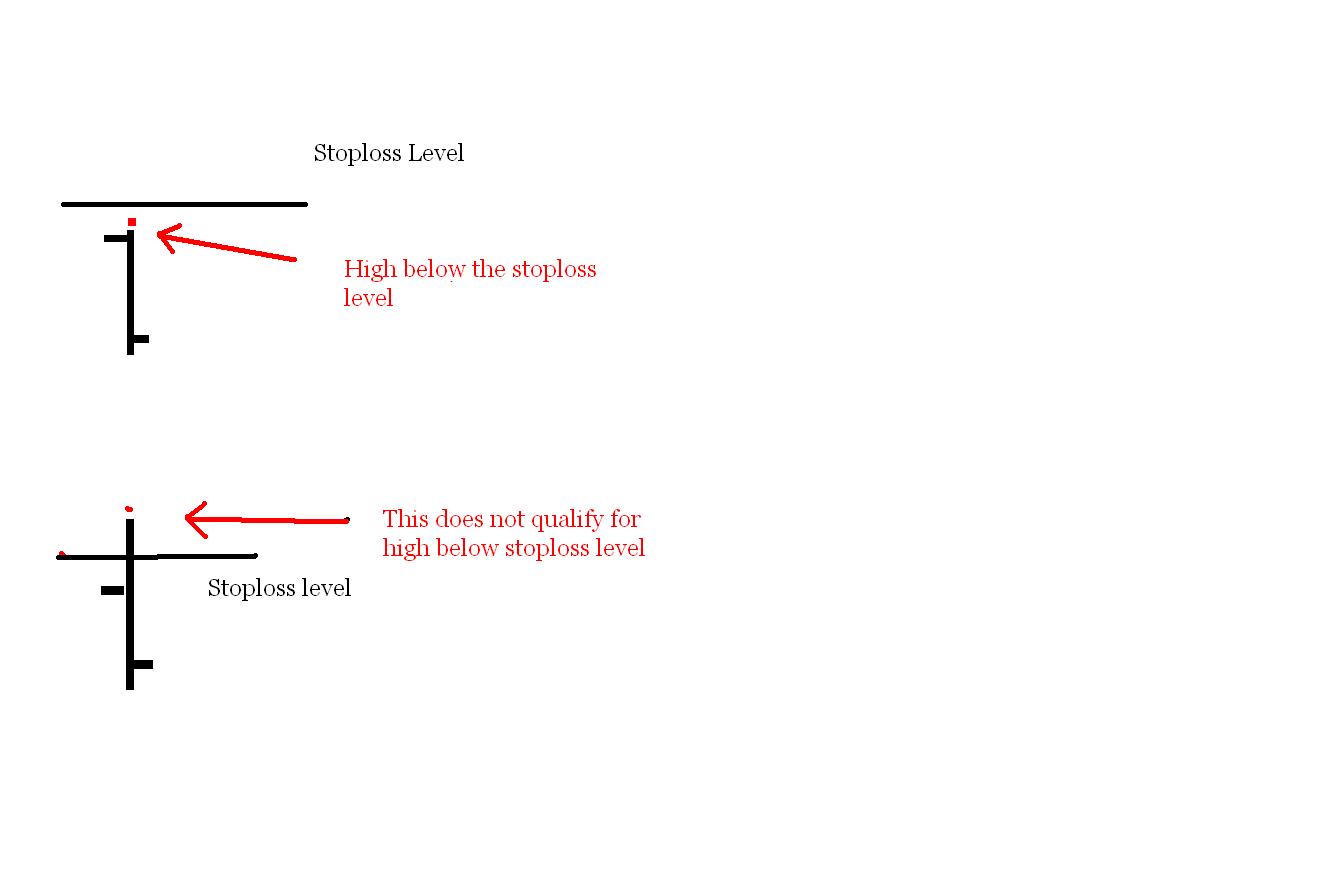
If market opens lower and then crosses 6007 and the high of any 15 min bar ( after it crosses 6007) does not go below, 5976 then it is a valid signal.The moment any 15 min bar high goes below 5976, then stop is triggered.
Do not try this system if you are not well versed with the above mentioned terminology and chart markings.
NIFTY 15 minute Chart
13 Feb
Disclaimer : These notes/comments have been prepared solely to educate those who are interested in the useful application of Technical Analysis. While due care has been taken in preparing these notes/comments, no responsibility can be or is assumed for any consequences resulting out of acting on them.Trading in Stocks/Commodities/Futures Carry Risk.Consult your financial advisor only before you trade.
CNX NIFTY 6,001.10 -82.90 -1.36 %
Nifty 15 min chart is depicted below.It has completed a TD Combo 13sell signal on 15 minute chart, which was the reason of fall today.Also it has completed a buy setup and TD Combo buy.One can go long above 6007, provided the high of 15 minute bar is not below 5976.(Warning : I am discussing about 15 min bar / candle and not daily high / low One should use Live charts while trading these setups).Also this is only for intra day trading.
If market opens lower and then crosses 6007 and the high of any 15 min bar ( after it crosses 6007) does not go below, 5976 then it is a valid signal.The moment any 15 min bar high goes below 5976, then stop is triggered.
Do not try this system if you are not well versed with the above mentioned terminology and chart markings.
NIFTY 15 minute Chart
Three charts from Bloomberg: Nifty, Appollo Tyre, CNXBank Index
http://imgur.com/qDMp4UF,sdKopSx,AbjUlvL
http://imgur.com/qDMp4UF,sdKopSx,AbjUlvL
Hi
I love all your hardwork for this and here is my developed afl i made it on tomdemark i have still some final stage to set this one with my wave count when complete i will share it for this forum .Please give me your feed back to improove it this is some of which i am currently using it with my experience on tomdemark count since last 8 years
and here is the afl
//TD Setup
pivot_dw = Ref(C,-1)>Ref(C,-5) AND C<Ref(C,-4);
pivot_up = Ref(C,-1)<Ref(C,-5) AND C>Ref(C,-4);
pivot_dw_dist = BarsSince(pivot_dw);
pivot_up_dist = BarsSince(pivot_up);
under4th = C<Ref(C,-4);
upper4th = C>Ref(C,-4);
TDset_buy = IIf(pivot_dw_dist==Sum(under4th,pivot_dw_dist),pivot_dw_dist,0);
TDset_sell = IIf(pivot_up_dist==Sum(upper4th,pivot_up_dist),pivot_up_dist,0);
TDset9_buy = TDset_buy==9;
TDset9_sell = TDset_sell==9;
LLVL2 = LLV(L,2);
HHVH2 = HHV(H,2);
setBuy_perf = LLVL2<=Ref(LLVL2,-2) AND TDset_buy>=9;
setSell_perf = HHVH2>=Ref(HHVH2,-2) AND TDset_sell>=9;
//TD Countdown
setBuy = Flip(TDset9_buy,TDset9_sell);
setSell = Flip(TDset9_sell,TDset9_buy);
TDSTrs = ValueWhen(TDset_buy==9,H,1);//ValueWhen(TDset_buy==1,H,1),1);
TDSTsp = ValueWhen(TDset_sell==9,L,1);//ValueWhen(TDset_sell==1,L,1),1);
/* TDCount original
DwCond = C<=Ref(LLVL2,-1);
UpCond = C>=Ref(HHVH2,-1);
*/
//TDcount modified
DwCond = L<Ref(LLV(L,BarsSince(Ref(setBuy,-1)==0 AND setBuy==1)),-1);
UpCond = H>Ref(HHV(H,BarsSince(Ref(setSell,-1)==0 AND setSell==1)),-1);
TDcountBuy = IIf(setBuy,Sum(IIf(setBuy AND DwCond,1,0),BarsSince(setBuy>Ref(setBuy,-1)))+9,0);
TDcountSell = IIf(setSell,Sum(IIf(setSell AND UpCond,1,0),BarsSince(setSell>Ref(setSell,-1)))+9,0);
CountBuyComplete = IIf(TDcountBuy>=13 AND C<ValueWhen(TDcountBuy==8,C,1),1,0);
CountSellComplete = IIf(TDcountSell>=13 AND C>ValueWhen(TDcountSell==8,C,1),1,0);
x=Cum(1);
for( i = 0; i < BarCount; i++ )
{
if((TDcountBuy==1 AND TDcountBuy[i-1]!=1) OR (TDcountBuy==3 AND TDcountBuy[i-1]!=3) OR (TDcountBuy==5 AND TDcountBuy[i-1]!=5) OR (TDcountBuy==7 AND TDcountBuy[i-1]!=7) OR (TDcountBuy==9 AND TDcountBuy[i-1]!=9) OR (TDcountBuy==13 AND TDcountBuy[i-1]!=13) OR (TDcountBuy==26 AND TDcountBuy[i-1]!=26) OR (TDcountBuy==38 AND TDcountBuy[i-1]!=38))
{
PlotText(NumToStr(TDcountBuy,1.0),i,L-5,colorBlack,colorWhite);
}
if((TDcountSell==1 AND TDcountSell[i-1]!=1) OR (TDcountSell==3 AND TDcountSell[i-1]!=3) OR (TDcountSell==5 AND TDcountSell[i-1]!=5) OR (TDcountSell==7 AND TDcountSell[i-1]!=7) OR (TDcountSell==9 AND TDcountSell[i-1]!=9) OR (TDcountSell==13 AND TDcountSell[i-1]!=13) OR (TDcountSell==26 AND TDcountSell[i-1]!=26) OR (TDcountSell==38 AND TDcountSell[i-1]!=38))
{
PlotText(NumToStr(TDcountSell,1.0),i,H+5,colorRed,colorYellow);
}
}
_SECTION_BEGIN("Price");
SetChartOptions(0,chartShowArrows|chartShowDates);
_N(Title = StrFormat("{{NAME}} - {{INTERVAL}} {{DATE}} Open %g, Hi %g, Lo %g, Close %g (%.1f%%) {{VALUES}}", O, H, L, C, SelectedValue( ROC( C, 1 ) ) ));
Plot( C, "Close", ParamColor("Color", colorBlack ), styleNoTitle | ParamStyle("Style") | GetPriceStyle() );
_SECTION_END();
| Thread starter | Similar threads | Forum | Replies | Date |
|---|---|---|---|---|
| R | Thomas Cook shares | Equities | 2 | |
| F | need afl conv "Moving beyond the closing price" by Thomas Stridsman-tradestation code | AmiBroker | 0 | |
| R | thomas cook | Position Trading | 0 | |
| Y | Thomas N. Bulkowskis patterns | AmiBroker | 4 | |
| A | pivots used by Thomas DeMark | AmiBroker | 7 |
Similar threads
-
-
need afl conv "Moving beyond the closing price" by Thomas Stridsman-tradestation code
- Started by ford7k
- Replies: 0
-
-
-