It's been a long time since I last posted. I made quite a few forecasts................. lets look at what actually happened.
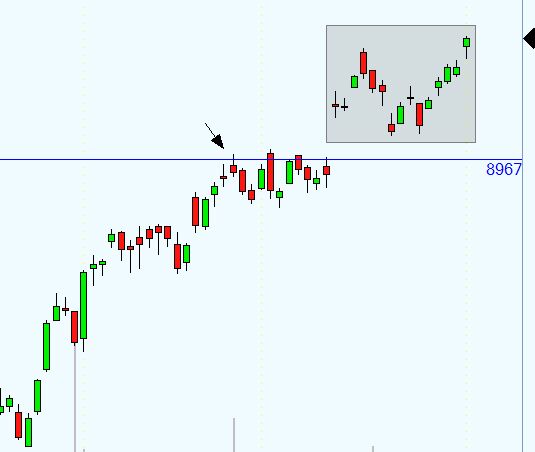
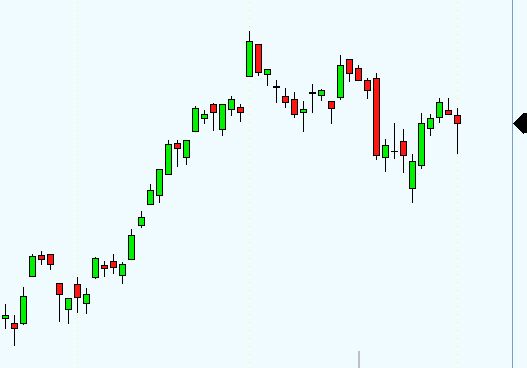
The highest high for 2017 is on 21st Feb at 8967 s.
I said that
8967 s on
21st Feb would be the
high for 2017. Price made 3 attempts to cross
8967 via gaps and failed each time.
The
highest close was on 6th March at 8967.8 s.
The rectangle encloses all price action after the election.
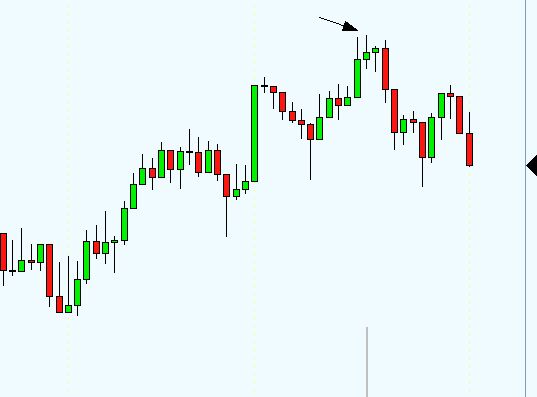
Any forecast chart I make will not be true since all price movement will occur
below my forecast high while
price has been above my forecast high for the last 15 days.
So what happens next ? Theres no point in posting bullshit numbers and then silently vanishing ............... so I will say that I don't know.
March 16th is the Dutch General election.
This is also the
2017 top for the European bboolll market
The high for the Cac was on the
21st March
The high for the Dax was on the
16th March
The Ftse high was on the
17th March
On the 27th when Theresa May announced that Britain would start the Brexit process, the
Dax and Cac started to rally.
According to my chart, this is the
last top for the S&P in 2017.........
The reality check for all starts now......... with earnings season.
Hyuna - Bubble Pop!
https://www.youtube.com/watch?v=bw9CALKOvAI


")