


Simple Coding Help - No Promise.
- Thread starter Happy_Singh
- Start date
Dear friend, u have to change this line
and replace it with this line 
I changed the 0 to colorblack
Code:
Plot( 100, /* defines the height of the ribbon in percent of pane width */"ribbon",
IIf( up1, colorGreen, IIf( sel1, colorRed,IIf(bluestar, colorDarkBlue, 0 ))), /* choose color */
styleOwnScale|styleArea|styleNoLabel, -0.5, 100 );
Code:
Plot( 100, /* defines the height of the ribbon in percent of pane width */"ribbon",
IIf( up1, colorGreen, IIf( sel1, colorRed,IIf(bluestar, colorDarkBlue, colorBlack ))), /* choose color */
styleOwnScale|styleArea|styleNoLabel, -0.5, 100 );
Last edited:
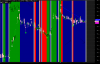
Hi DearRomeo God bless you man.as you can see i change green and red to black also but i have grey color .what should i do? i want balck on my background only.
Code:
Plot( 100, /* defines the height of the ribbon in percent of pane width */"ribbon",
IIf( up1, colorBlack, IIf( sel1, colorBlack,IIf(bluestar, colorBlack, 0 ))), /* choose color */
styleOwnScale|styleArea|styleNoLabel, -0.5, 100 );
///////////////////////////////////////////////////////
Attachments
-
 14.6 KB Views: 45
Dear friend,
thank u for ur kind words
may GOD always bless u, me and everyone else
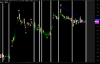
if u want only black colour in background, then replace this code
with this code
1)
OR with this code
2)
the better option is the 2nd code
thank u for ur kind words
may GOD always bless u, me and everyone else
if u want only black colour in background, then replace this code
Code:
Plot( 100, /* defines the height of the ribbon in percent of pane width */"ribbon",
IIf( up1, colorBlack, IIf( sel1, colorBlack,IIf(bluestar, colorBlack, 0 ))), /* choose color */
styleOwnScale|styleArea|styleNoLabel, -0.5, 100 );
///////////////////////////////////////////////////////1)
Code:
Plot( 100, /* defines the height of the ribbon in percent of pane width */"ribbon",
IIf( up1, colorBlack, IIf( sel1, colorBlack,IIf(bluestar, colorBlack, colorBlack ))), /* choose color */
styleOwnScale|styleArea|styleNoLabel, -0.5, 100 );2)
Code:
SetChartBkColor(colorBlack);
Last edited:
wonderful !!!excellent .perfect.do you have telegram messenger on your mobile? i wanna to have your id like telegram or imo or.. to contact with you .i hope you will give me here my telegram id:https://t.me/Houmansat
thanks.
thanks.
Dear friend Jalpesh123,
this code will buy at 9:17 am and will close that position when price will be (buyprice + 1 % of buy price)
e.g. bought at 300, so it will sell at 303
here is the code
this code will create a short position at 9:17 am and will close that position when price will be (shortprice - 1 % of short price)
e.g. opened a short position at 300, so it will cover at 297
here is the code
this code will buy at 9:17 am and will close that position when price will be (buyprice + 1 % of buy price)
e.g. bought at 300, so it will sell at 303
here is the code
Code:
Buy = TimeNum()==91700;
Sell=0;
ApplyStop(1,1,1,1);
this code will create a short position at 9:17 am and will close that position when price will be (shortprice - 1 % of short price)
e.g. opened a short position at 300, so it will cover at 297
here is the code
Code:
Short=TimeNum()==91700;
Cover=0;
ApplyStop(1,1,1,1);
Last edited:
hi dear romeo.is it possible to add more option for this trend line imean i want to change trend line wedge by my self.
Code:
_SECTION_BEGIN("RSI Trendlines and Wedges");
/*RSI Trendlines and Wedges*/
G=0;// set G=1, 2, 3, ... to see previous Resistance trendlines
GG=0;// set G=1, 2, 3, ... to see previous Support trendlines
x = Cum(1);
per = 1;// sensitivity calibration
s1=RSI();s11=RSI();
Plot(RSI(),"RSI",9,8);
pS = TroughBars( s1, per, 1 ) == 0;
endt= LastValue(ValueWhen( pS, x, 1+GG ));
startt=LastValue(ValueWhen( pS, x, 2+GG ));
dtS =endt-startt;
endS = LastValue(ValueWhen( pS, s1, 1+GG ) );
startS = LastValue( ValueWhen( pS, s1, 2+GG ));
aS = (endS-startS)/dtS;
bS = endS;
trendlineS = aS * ( x -endt ) + bS;// the Support trendline equation
Plot(IIf(x>startt-6 AND TRENDLINES>0 AND TRENDLINES<100,trendlineS,-1e10),"Support",IIf(as>0,5,4),8);
pR = PeakBars( s11, per, 1 ) == 0;
endt1= LastValue(ValueWhen( pR, x, 1+G ));
startt1=LastValue(ValueWhen( pR, x, 2+G ));
dtR =endt1-startt1;
endR = LastValue(ValueWhen( pR, s11, 1+G ) );
startR = LastValue( ValueWhen( pR, s11, 2 +G ));
aR = (endR-startR)/dtR;
bR = endR;
trendlineR = aR * ( x -endt1 ) + bR;// the Resistance trendline equation
Plot(IIf(x>startT1-6 AND TRENDLINER>0 AND TRENDLINER<100,trendlineR,-1e10),"Resistance",IIf(Ar>0,5,4),8);
Ascwedge=Ar>0.5 AND As>sqrt(2)*Ar AND trendlineR>trendlineS;
Descwedge= As<-0.5 AND As>Ar/sqrt(2) AND trendlineR>trendlineS;
Filter=1;
AddColumn(Ascwedge,"AscWedge",1.0);
AddColumn(DescWedge,"DesWedge",1.0);
AddColumn(Ascwedge AND trendlineS>50 AND RSI()>50,"Probable Bearish Breakout",1.0);
AddColumn(Descwedge AND trendlineR<50 AND RSI()<50,"Probable Bullish Breakout",1.0);


/* END of code */
_SECTION_END();Dear friend houmansat,
its good to hear from u again
adjust the sensitivity from parameters
here is the code
its good to hear from u again
adjust the sensitivity from parameters
here is the code
Code:
_SECTION_BEGIN("RSI Trendlines and Wedges");
SetChartOptions(0,0,chartGrid30|chartGrid70);
periods = Param( "Periods", 14, 1, 200, 1 );
Plot( RSI( periods), _DEFAULT_NAME(), ParamColor( "Color", colorlightblue ), ParamStyle("Style",styleThick)  );

/*RSI Trendlines and Wedges*/
G=0;// set G=1, 2, 3, ... to see previous Resistance trendlines
GG=0;// set G=1, 2, 3, ... to see previous Support trendlines
x = Cum(1);
per = Param("Sensitivity",1,1,100,1); // sensitivity calibration
s1=RSI();s11=RSI();
pS = TroughBars( s1, per, 1 ) == 0;
endt= LastValue(ValueWhen( pS, x, 1+GG ));
startt=LastValue(ValueWhen( pS, x, 2+GG ));
dtS =endt-startt;
endS = LastValue(ValueWhen( pS, s1, 1+GG ) );
startS = LastValue( ValueWhen( pS, s1, 2+GG ));
aS = (endS-startS)/dtS;
bS = endS;
trendlineS = aS * ( x -endt ) + bS;// the Support trendline equation
Plot(IIf(x>startt-6 AND TRENDLINES>0 AND TRENDLINES<100,trendlineS,-1e10),"Support",IIf(as>0,5,4),8);
pR = PeakBars( s11, per, 1 ) == 0;
endt1= LastValue(ValueWhen( pR, x, 1+G ));
startt1=LastValue(ValueWhen( pR, x, 2+G ));
dtR =endt1-startt1;
endR = LastValue(ValueWhen( pR, s11, 1+G ) );
startR = LastValue( ValueWhen( pR, s11, 2 +G ));
aR = (endR-startR)/dtR;
bR = endR;
trendlineR = aR * ( x -endt1 ) + bR;// the Resistance trendline equation
Plot(IIf(x>startT1-6 AND TRENDLINER>0 AND TRENDLINER<100,trendlineR,-1e10),"Resistance",IIf(Ar>0,5,4),8);
Ascwedge=Ar>0.5 AND As>sqrt(2)*Ar AND trendlineR>trendlineS;
Descwedge= As<-0.5 AND As>Ar/sqrt(2) AND trendlineR>trendlineS;
Filter=1;
AddColumn(Ascwedge,"AscWedge",1.0);
AddColumn(DescWedge,"DesWedge",1.0);
AddColumn(Ascwedge AND trendlineS>50 AND RSI()>50,"Probable Bearish Breakout",1.0);
AddColumn(Descwedge AND trendlineR<50 AND RSI()<50,"Probable Bullish Breakout",1.0);
/* END of code */
_SECTION_END();Hi Dear Romeo you are really an expert. as usual you are wonderful man. i dont know how to be thankful.will you plsease add scan/explorer to this .buy on support sell on resistance. and also consider difference indicator from main trendline option (from 1 to 5)
somthing like this h have but i dont know where i should add it .your sensitivity trendline is working only for rsi 14. when i change rsi for example rsi =9 trend lines is not adjust to rsi 9. please check it am i right?
and for scan/explorer i have this:
BEST WISHES")
somthing like this h have but i dont know where i should add it .your sensitivity trendline is working only for rsi 14. when i change rsi for example rsi =9 trend lines is not adjust to rsi 9. please check it am i right?
Code:
MainTrendLine_Diff = Param("Difference IND from MainTrendLine", 2.5, 0.5,7,  0.5);

d = starthigh ;
FirstDownSlope = (secondhigh - d) / (secondhighbar - starthighbar) ;
FirstDownTrendline = FirstDownSlope * ( BarIndex() - starthighbar ) + d;

SecondDownSlope = (thirdhigh - d) / (thirdhighbar - starthighbar) ;
SecondDownTrendline = SecondDownSlope * ( BarIndex() -  starthighbar ) + d;

ThirdDownSlope = (fourthhigh - d) / (fourthhighbar - starthighbar) ;
ThirdDownTrendline = ThirdDownSlope * ( BarIndex() - starthighbar ) + d;

FourthDownSlope = (fifthhigh - d) / (fifthhighbar - starthighbar) ;
FourthDownTrendline = FourthDownSlope * ( BarIndex() - starthighbar ) + d;

FifthDownSlope = (sixthhigh - d) / (sixthhighbar - starthighbar) ;
FifthDownTrendline = FifthDownSlope * ( BarIndex() - starthighbar ) + d;

MainDownSlope = IIf( FirstDownSlope < SecondDownSlope,  IIf( SecondDownSlope < ThirdDownSlope,
IIf( ThirdDownSlope < FourthDownSlope,  IIf( FourthDownSlope <  FifthDownSlope, FifthDownSlope, FourthDownSlope),ThirdDownSlope), SecondDownSlope), FirstDownSlope) ;

MainDownLine =  IIf( MainDownSlope == 0, Null, MainDownSlope * ( BarIndex() - starthighbar ) + d ) ;
Plot(  IIf(  BarIndex() >=  starthighbar, MainDownLine, Null ) , "Main_DOWN_Line", colorViolet, styleThick ) ;

IND_Diff = IIf(  BarIndex() >=  starthighbar, abs( IND - MainDownLine), Null) ;

Cond_Sell = IIf( BarIndex() >= Thirdbar AND  IND_Diff  <= MainTrendLine_Diff, IND, 0)  AND  MainDownLine > 45 ;

PlotShapes( IIf( Cond_Sell, shapeDownArrow , shapeNone ), colorRed );
Code:
Filter=Cond_buy OR Cond_sell;
AddColumn(IIf(Cond_buy,Close,Null)," Buy ", 6.2,1.2,colorGreen);
AddColumn(IIf(Cond_sell,Close,Null)," Sell ",6.2,1.2,colorOrange);
Last edited:
Similar threads
-
Convert Simple Thinkscript Support/Resistance Lines into AFL
- Started by StockTempest
- Replies: 4
-
-
Coding help.........adding exploration for the simple combo
- Started by praveen5344
- Replies: 2
-
Help with simple coding...........SUPERTREND AND STOCHASTICS
- Started by praveen5344
- Replies: 3
-