Sharing the trading technique

mitasatyajit

Well-Known Member
#21
well satyajit da

among trendline workers,,,
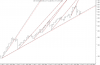
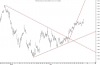
i am from amongst them,,i basically work on trend line / fib ..and gann angles,,
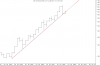
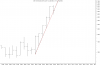
well,,,see the long trend line,,become sso boring that at times we should book profit ,, on major runs and trend line res,,,,and then agian buy at trend line support,,
on quanity suitable ...since the investment sjall be now of bigger value
instead of 100 now only one can buy 50
i hope undretsood,,
when time i shall too post on trend line working which i think si most simple,,,,and easiest tecnhique

renu
I am eagerly waiting for your post Renu and for learning more from u. Please keep posting.

Regards.

Satyajit
 

mitasatyajit

Well-Known Member
#22
Have a few questions about trendline :
In ABB chart the line drawn from June 2006 to beyond August 2007 is shown as major trend where as the trendline drawn from June 2006 to December 2006 is shown as Minor or secondary trendline.
Would it be correct to say that :
The Trendline from June to Dec 2006 was THE MAJOR TRENDLINE fromed in August 2006.
The Trendline (major) from june 2006 to aug 2007 came into existance only after the low in March 2007 was formed."


- My second lesson in the technical analysis was "DO NOT PREDICT THE MARKET"

The trend line which will be formed in future will not become the part of the analysis.

Before March 2007, the "minor trendline" drawn in the power point presentation would be considered as "major trendline" at that time. Watch, u could draw the minor trend lines also.

I think i could clear ur doubts, is not it ?


During Dec 2006 the Treendline (at that time major trendilne) was breached and weexited the Longs, but again the Trendline was breached on upside, do we go long again and get stopped.

No problem, u can exit when the stop breached and enter again when above trend line. As the trend line is upward there will be no loss or u will get little profit if u again breach ur stop.

Though it is very clear that in trending market it is giving stupendous runs and small SL but to understand the methodolgy do kinly give some more inputs.

Sure, time to time the charts will be posted.

As the trendline from June 2006 to dec 2006 is breached, do we draw a down trendline!!! Becoz till the price stopped southward journey in March 2007 we did not know that a Fresh MAJOR trendline is formed and price is taking support on it. Till then the price was in downtrend for us.
Kindly reply as if to an absolutely raw person in TA.....I am a newbie as far as TA is concerned though associated with Stocks for long.
Thanks and regards
Gautam


Fantastic. If u think open minded, the ways will be opened up. As u say u r absolutely new in TA, u will grasp the technique very fast.

I shall be waiting for your post during and after ur achievements.

Regards.

Satyajit
 

mitasatyajit

Well-Known Member
#23
Forgot to ask :
What is : Make Y axis in Log scale!!!!:
:confused:
Yes it is required. Otherwise u have to draw x = log y as the trend line not straight line (y = mx + c).

I think in every charting software (like metastock / amibroker etc.)there is a tool of converting the y axis in log scale.

Regards.

Satyajit
 

rkkarnani

Well-Known Member
#29
The "Raso golla" was very good in traderji meet in kolkata.

Thanks in advance for next "Raso golla".

Regards.

Satyajit
Satyajit da, Mine was rosogolla just for an afternoon, but what you are teaching...., you are giving... is to provide Rosogollas etc. etc. etc. for life.......
Really nice of you and now Renu ji too to be so selfless!!!!
 
V

vvvv

Guest
#30
Example of Nifty in Monthly Chart and in other time formats.

Regards.

Satyajit
trendline analysis looks very gud on past data where u can clearly find out whts happening.wht abt the future??how u trade with the trend line.
ur powerpoint was a gud theoretical lesson..still fail to understand how u do real time intra-day trading with it..will not be clear unless u post a live video of ur trading session.
thnks
 

Similar threads