Saint's Thread followers - Identified UpTrends/ DownTrends

#11
Hmm...I take back my words. (Removed that from the original text:D ) What I meant was comparing to other mid-caps which have almost seen rock bottom, with my little experience I viewed it in this aspect. Apologies.


AGILENT- Thanks for your financials pdf.

AJAY - Thanks for catching me by the ears..

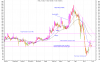
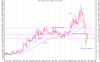
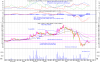
Can someone please comment on the trendlines/support/resistance/buying opportunities?

Cheers
Satish

PS- you both earned your rights to shoot me down. Let me know where I can send you the bullets :(
 
#12
Agilent said:
Excuse me Satish... but dont u think the recent fall from the 52 week high (240) to the 52 week low (80)... all in a matter of weeks ... is a v steep fall, and much steeper than that of Sensex or Nifty.

Or am I missing something ??

AGILENT


Satish


I presume u r long in this counter

Maybe u can share with us whether your entry was influenced only by the charts or did u have any knowledge of the improving (?) Fundamentals.

If u had some idea of the latter (Fundamentals .. mainly financial trends) surely u may be keeping track of how the co. has fared this yr ... and what is the outlook for this yr (remember its primarily the forward EPS which will determine the price target from year to year)

Satish ... don't get me wrong... there's no law which says u must keep an eye on the Fundamentals... but note that if you HAVE that additional info , u will be able go get much more mileage from the charts. Makes sense ?

So... what do u think

AGILENT;)
 
#13
Hi

This is my opinion about the Analysis


satish_goteti said:
My first is KRBL Limited.

Basics : Fundamentally a strong scrip. Check out the weekly charts.
How can we say that it is a fundamentally strong scrip by looking at the weekly chart

satish_goteti said:
Other Points : Good to moderate volumes last 5 weeks.
Look at volume the steep fall was with high volume, now the volume has become low

satish_goteti said:
Weekly Trend : Not clear. Downtrend is in Question. Good Rally towards the 128 areas. Up trend confirmed if rally breakout on the resistance at 150 levels. Uptrend here can be identified if a new pivot low is made above the current pivot low at 78.83. Am I right so far? Saint if you are reading this please don't kill me if I am so gross.
Downtrend has vaned surely.look at the flattening ADX. But there is surely no sign of any up trend. The price is below the short, medium and long term MA.

satish_goteti said:
Daily Trend : UpTrend. Higher pivot lows and highs clearly visible. There are two buying opportunities identified using Green Arrows. The first one because it has taken out the previous bar's high. The second opportunity is a repetition of the previous opportunity except that the bullish candle has taken out the previous high in the first instance. Please can someone comment on my trendlines/support and resistance and let me know if my support and resistance identification is correct and also my trendlines.
Surely the Daily chart is still dominated by bearishness. The weekly MA(5) < Monthly MA(20) < Quarterly MA(50)

Moreover the trendlines are not broken yet. I would stay away from this stock at this time. Wait for better oppurtunity.

I am enclosing some charts for you reference.

Cheers

TA Chartist
 

Attachments

#14
Agilent said:
I presume u r long in this counter

Maybe u can share with us whether your entry was influenced only by the charts or did u have any knowledge of the improving (?) Fundamentals.

Nope I dont have any position on this stock. I was only following this chart for quite sometime and applying learnings from Saint's teaching :D

Agilent said:
If u had some idea of the latter (Fundamentals .. mainly financial trends) surely u may be keeping track of how the co. has fared this yr ... and what is the outlook for this yr (remember its primarily the forward EPS which will determine the price target from year to year)
Not really..I think I quoted it wrong. I did not mean fundamental the way you guys mean. Looking at the weekly chart and the way it has moved over the time from a technical standpoint I saw this to be a stable stock except for the last few weeks. This is purely as how the eye sees it. I will change that text. Phew. :eek:

Agilent said:
Satish ... don't get me wrong... there's no law which says u must keep an eye on the Fundamentals... but note that if you HAVE that additional info , u will be able go get much more mileage from the charts. Makes sense ?
Completely agree with you..
 
#15
tachartist said:
Hi

This is my opinion about the Analysis

How can we say that it is a fundamentally strong scrip by looking at the weekly chart
I meant consistent growth looking at the weekly charts. I take back my words again :-(. Please note I am not a fundamental analyst at all.

tachartist said:
Look at volume the steep fall was with high volume, now the volume has become low
Please underline the word moderate. You guys are reading too much into my lines...Is this a sign for me to shut up?:confused:

tachartist said:
Surely the Daily chart is still dominated by bearishness. The weekly MA(5) < Monthly MA(20) < Quarterly MA(50)
hmm...As a swing trader you could take some risks here don't you think? Agree with your comments on the bearishness and I have no clue on the MA (50) stuff. So you know what level I am at..:-(


tachartist said:
Moreover the trendlines are not broken yet. I would stay away from this stock at this time. Wait for better oppurtunity.

Thanks for this. I agree with you but I am going back to Saint's thread and fact that KISS (KEEP IT SHORT AND SIMPLE). I have a question back on this. How will anyone represent this kind of move on the charts?

Thanks a ton for being a very good critic. Need more of these comments to sharpen the saw..

Regards
Satish
 

karthikmarar

Well-Known Member
#16
Satish

There is no need to "Shutup". Feel free to put forward your thoughts and ideas. The comments will only help you to learn. This is a very helpful forum and nobody will pull you up for any sort of question. You are doing fine. Keep going. We are all learning here.

regards

Karthik
 
#18
pkjha30 said:
Truth springs from argument amongst friends.

--- David Hume:

Thats a great quote , PK , thanks

And it also gives me the courage to forewarn u abt a couple of arguments I have lined up with u ...

So stand by ... hehe

AGILENT;)
 
#19
Agilent said:
Satish

To help you out with KRBL, I have attached a chart on the recent financials (The co exports rice to Saudi, by the way)

Am sure this will be of help, though financials more recent than QE12/05 are not known (not to me at least) ... In case u know, do post them ... am sure they will be of immense use and may explain the recent chart patterns (after all.. we all know that its the fundamentals which drive and mould the technicals)

Hope this helps ... I will be happy to provide such FA perspective whenever you need
Agilent

Here are the more recent results of KRBL Limited. Your views are highly appreciated.

KRBL Results

Regards
Satish
 
#20
karthikmarar said:
Satish

There is no need to "Shutup". Feel free to put forward your thoughts and ideas. The comments will only help you to learn. This is a very helpful forum and nobody will pull you up for any sort of question. You are doing fine. Keep going. We are all learning here.

regards

Karthik
Thanks Karthik/Pankaj/Agilent.

Regards
Satish
 

Similar threads