Brooks price action traders are increasing and this is a good sign to exchange ideas.If someone post their chart I will try to give my analysis, hard to squeeze in time, so maybe fortnightly.Looking at Gaurav’s chart. Real good trades, 4 out of 4, great going Gaurav. Here are some of my observations.
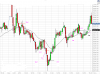
Bar1 is a good bear bar, short on bar2 with target 2 times the risk.
By bar3 always-in is short, it is a good spike and possible measure move is likely and hence scale-in on any pullback. This came in the form of a breakout pullback short on bar6.
Bar9 gave H2 at the moving average, but selling pressure is more, which is confirmed on the weak entrybar 10 and bad follow through on 11.Trapped longs will exit under bar11 as well as underbar3 .Reasonable to expect atleast a 2 legged down move.
So Spike and channel is to be expected.
The move down to bar 23 has only 2 bull bars and hence any pullback is only to add on shorts.
Bar 30 gave L2 in a bear move and hence shorting on the outside down bar is a great short.
Since there is a trend line break on the move up to bar 31, this might become final flag.
Any reversal up with good set up is a lower low major trend reversal.
Bar 34 overshot the trend channel line and is at the measured move based on the spike.
Also it is the largest bar of the protracted bear move and hence climactic bar.So exit all shorts.Any climactic move will have atleast ten bar two legged correction.
Bar 35 is a good reversal bar but after 4 consecutive bear bars and hence wait for pullback.
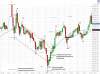
Long entry on one tick above bar 36 as it is a breakout pullback.Bar 37 entry bar is strong and there is breakout gap with bars 36 and 38 which is a sign of strength.
Always-in is long at this point. Target would be 2 times the risk and would have been reached on bar 42.
Bars 35,37,39 are three pushes up on smaller time frame, but it is in a microchannel and hence going long above bar 40 is good.Thats why bar 41 is also a breakout bar(failed three push)
Stop would be 1 tick below bar 41 and the target is the height of three push pattern( bar 34 low to bar 40 high which is the blue line at 12660).
Bar 43 is the first pause bar and hence entering on limit order at below bar 43 is good long, with stop below bar 41.This it third long setup, but the traders equation atleat 60% for reward one times the risk.
So does H1 entry above bar 44.
The move from bar 35 to bar 49 is strong and hence any counter-trend move is only to enter long. Going long at the moving average, on the close of bars 51,52,53 is good.
Bar 53 gave pullback to the moving average, higher low major trend reversal long one tick above its high. Target of 2 times the risk reached on last but one bar.
Bar 67 gave another higher low long setup.
The move down to 53 broke the trendline from bar 35 and hence bar 64 ioi is short setup.
But the entry will be in the middle of the trading range and hence a bad setup.Also the bottom
taiils on bars 64,65,66 show buying into the close.Also always-in is still long.