Nifty Elliott Wave Analysis

#41
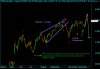
Nifty touched 4979 as mentioned making a triangle for wave (4).the thrust out of triangle is wave (5) which if completed ,will retrace to 5040-5060 or above area upwards to complete wave 4 & then test the 4979 bottom for wave 5 ( see projection in white lines).

DISCLAIMER The content given here is only for Educational purpose & not for Trading.The Analyst cannot be held responsible for any losses incurred by acting on the content.Trading in Futures & stock market is Risky.So consult your own Financial Analyst to trade.


#42
Nifty may face strong resistance near 5000 levels.If it convincingly crosses 5000 ,5040-5060 may be tested


DISCLAIMER The content given here is only for Educational purpose & not for Trading.The Analyst cannot be held responsible for any losses incurred by acting on the content.Trading in Futures & stock market is Risky.So consult your own Financial Analyst to trade.


#43
Nifty may test 5000-5040 levels for intermediate 4 th wave which appears to be an expanded flat & then come below 4952.Overall since larger C wave is forming Nifty will test 4538.5 if count is correct.

The wave count is negated if Nifty touches 5090

DISCLAIMER The content given here is only for Educational purpose & not for Trading.The Analyst cannot be held responsible for any losses incurred by acting on the content.Trading in Futures & stock market is Risky.So consult your own Financial Analyst to trade.


#44
Nifty Crossed 5182.55 & a relook at the Wave count is illustrated below.The first one is the preferred count.Here Nifty is still forming wave B which is a Zigzag & the C wave of a Zigzag can normally be from 61.8 % (5182) ,100 %(5408) ,to 161.8 % which we will see only if it crosses 5408.After finishing wave c of the Zigzag,we will complete Wave B or larger degree & then Wave C down to 4538.5 levels.

The second alternative is the Expanding Diagonal triangle which is considered very rare.Here after the wave 5 is completed we will test the bottom of the diagonal Triangle which is 3900

So First case is very mildly bullish .Second case is somewhat Bullish to 5400-5700 levels then very bearish.


DISCLAIMER The content given here is only for Educational purpose & not for Trading.The Analyst cannot be held responsible for any losses incurred by acting on the content.Trading in Futures & stock market is Risky.So consult your own Financial Analyst to trade.


Expanded Diagonal Triangle

 
#45
elliott wave trading is nothing but dealing with probabilities till date my counts were not goin with urs,that doesnt matter opinions differ,no one is here to claim supremacy,but at last we have something in common,go thru my counts another probability is in the making
 

Attachments

#46
Yes ,Ranjan,my second Chart shows that we may be forming an expanded Diagonal Triangle,& even I have given that Wave down will come to 3900 i.e start of the Diagonal Triangle,if indeed it is a Diagonal Triangle.
 

kainiteh

Well-Known Member
#49
Good work! Bimbo

i am trading Equities using E-Wave and ABC correction with momentum indicator and Fib Retracement

Simple Rule that i has been following is
1.wave 2 should not exceed wave 1
2.wave 3 should greatest in price and time among wave 1,2,3
3.wave 4 should not overlap with wave 1

wave 1,3,5 should be impulsive
wave 2,4 may be ABC correction


we may enter above white line on this chart
Reason:Wave C created impulsive,because of
wave 5 of C completed trend once it cross
wave 4 of C..so we may enter so earlier and with less SL
 

Similar threads