


Hi,
Ive been reading about technical analysis for a couple of months, and have started trialing some systems in the FTSE 350, on my own software made in Matlab.
I thought testing over the past 3 months data would be relevant since the market behaviour too far back doesn't seem relevent.
I'm using the indicators which seem most popular from what I have seen for buy signals:
MACD, bollinger bands and RSI
26,12,9 day periods for MACD,
9 days for RSI
20 days for bollinger
Then using Alexander Elder's safezone stop system with a lookback period of 10 days.
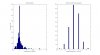
I've tried multiple combinations of the buy signals but everything I try gives pretty much the same outcome. Plotting histograms of my %profit for all stocks and number of wins/losses for individual stocks over the time period (3 months), It looks as if my technical analysis gives no advantage at all.
Are my ttime periods used in the buy signal indicators way out, or is it just a bad time to trade?
Thanks for any advice
Adam
Ive been reading about technical analysis for a couple of months, and have started trialing some systems in the FTSE 350, on my own software made in Matlab.
I thought testing over the past 3 months data would be relevant since the market behaviour too far back doesn't seem relevent.
I'm using the indicators which seem most popular from what I have seen for buy signals:
MACD, bollinger bands and RSI
26,12,9 day periods for MACD,
9 days for RSI
20 days for bollinger
Then using Alexander Elder's safezone stop system with a lookback period of 10 days.
I've tried multiple combinations of the buy signals but everything I try gives pretty much the same outcome. Plotting histograms of my %profit for all stocks and number of wins/losses for individual stocks over the time period (3 months), It looks as if my technical analysis gives no advantage at all.
Are my ttime periods used in the buy signal indicators way out, or is it just a bad time to trade?
Thanks for any advice
Adam
Attachments
-
 57.4 KB Views: 24
")