Dear Traderji and other members,
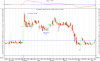
Going through the charts many a times you come with a situation of how to draw a pattern cause many options are seen. Below I am attaching two files of Tata steel. In one I have drawn a Wedge and on the same time frame I have drawn a ascending triangle. Now which one should we take for our study. If we take it as a wedge...we also see falling volume with increase in price. This is Formed during a down trend. Hence could be bearish.
Now if we take it as a right angled triangle. In this formation volume should decline as the formation takes place(which is normal and is happening)and then the volume should increase on break out on either side.
which would make a more valid pattern. Also if you see after such a fall, most of the shares are moving in tandem to the market, so many scripts are showing similiar patterns. So would it not be advisable to use patterns as such a stage.
Looking forward to participation of all members.
Rgds
Rahul
Last edited: