Hi SS,
wonderful work my friend!
well, i have attached your RCOM charts.
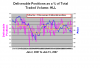
have studied divergence between moving average of dP and price.
i observed:
if price is rising and MA of dP falling, bearish divergence.....distribution
if price is falling and MA of dP risig, bullish divergence.......accumulation
for price, i have marked red line, for dP have marked black line.
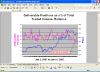
Also, another chart, i have observed simple stupid system having auto stops.
Rule:
buy when price cuts 10 EMA of dP from downward to upward
sell when price cuts 10EMA of dp from upward to downward
all members, please improve me and our knowledge,
Take care,
Winston
wonderful work my friend!
well, i have attached your RCOM charts.
have studied divergence between moving average of dP and price.
i observed:
if price is rising and MA of dP falling, bearish divergence.....distribution
if price is falling and MA of dP risig, bullish divergence.......accumulation
for price, i have marked red line, for dP have marked black line.
Also, another chart, i have observed simple stupid system having auto stops.
Rule:
buy when price cuts 10 EMA of dP from downward to upward
sell when price cuts 10EMA of dp from upward to downward
all members, please improve me and our knowledge,
Take care,
Winston
Last edited:
")