VijKris,
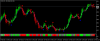
The problem with looking at charts eod is that it looks perfect. And the reason is that MA repaints. So what is looking now like a prefect chart, at that time, would not have had a MA crossover. As the price moved up dramatically, the MA tightened up (as it appears eod) and hence looks like a perfect time to take the trade.
I have been experimenting on RENKO charts with MA's when I noticed this problem. So working on some alternative indicator, which does not not have similar problem.....
My 2C.