Buying on Dips

#21
Hoping for help from the Fed
The Federal Reserve's policy meeting takes center stage this week as investors wait for word on the future course of interest rates.
By Steve Hargreaves, Jessica Seid and Grace Wong, CNNMoney.com staff writers
June 24, 2006: 5:47 PM EDT


NEW YORK (CNNMoney.com) - As stocks continue their volatile ride along what appears to be the bottom of a market downturn, investors will focus on one key event next week: The statement from the Federal Reserve's policy meeting.

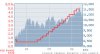
That the Fed will raise rates yet again when it meets June 28 and 29 is nearly certain. Rate futures on the Chicago Board of Trade put the likelihood of a quarter-percentage point raise in the fed funds rate at 100 percent.


That would bring the target for a key short-term interest rate to 5.25 percent and mark the 17th straight hike after two straight years of steady rate increases.

Some are even betting central bank policy-makers could bump up the rate by as much as half a percentage point."The only real wild card is how hawkish the Fed statement will be," said Art Hogan, chief market strategist at Jefferies & Co.

Fear of inflation and uncertainty about how far the central bank will go with its rate hiking campaign have been weighing on markets since mid May. Last week all three major indexes hit lows for the year, and what has followed has been days of volatile up and down trading.

The Dow finished the week down 0.2 percent, the broader S&P 500 index lost 0.5 percent on the week, and the tech-heavy Nasdaq fell 0.4 percent.

Although commodity prices have eased from near record highs over the past week or so, investors still fear higher prices will begin to creep into everyday goods and spark a jump in inflation that will cripple economic growth.

But investors are also concerned an overzealous Fed will raise interest rates too high and choke off the flow of cheap capital, making it harder for businesses to make money and also triggering an economic downturn.

By the numbers
A slew of economic reports are due next week, and that could mean more volatility, according to Peter Cardillo, chief market analyst at S.W. Bach & Co.

"Next week we have a lot on the plate, the FOMC meeting, end-of-the-quarter window dressing (when fund managers tweak their clients' portfolios) and a slew of economic data," he said.

May readings on personal income and spending are likely to be closely watched. Economists are calling for a moderate decline in both measures, and investors will hope the numbers aren't too far out of line.

"As we look at the data releases ahead, the most important will be the personal consumption numbers," Hogan said.

Investors will be focusing on the inflation readings from the reports, which many economists say is a more accurate reading of inflation than the closely watched consumer and wholesale price reports. Some say the so-called core PCE price reading in the report is also the most important to the Fed. (Full story.)

The Fed usually gets a look at government economic reports a day before they're released to the public, so it's likely policy-makers will see the inflation reading in the income and spending report before they release their statement Thursday.

"Barring any major news positive or negative, I think we're going to be sideways into the Fed decision," Hogan said.

Other numbers of interest next week include new home sales set for release Monday, consumer confidence and existing home sales on Tuesday, and a final reading on first quarter gross domestic product Wednesday.
 
#22
hai all, the markets are still evenly poised and there maybe some upside left.
the disturbing trend is that all technology stocks of indian companies listed in nasdaq seem to be bearish and this will spill over to indian markets.hence the real fall will be from index heavyweights INFOSYS and SATYAM, with their indicators pointing to overbought zone (60% bearish).Hence watchout on these shares.
STOCKS TO BUY ON DIPS

1. ICICI BANK
2. Dr.REDDYS

Accumulate small lots on every dip and book partial profit in August.
bye
ravi
 
#23
Outsource our Government to India; Save Taxpayers Money
By Lance Winslow


Well it looks as if we need to make some serious choices with our government, as they just will not stop spending will they? They just keep blowing money on all sorts of crap, none of really relevant to anything in the Constitution, except the military expenditures perhaps.

Nevertheless it is time to downsize and cut costs right? Sure and how are we going to do that? Well we can do what corporations do when they have had enough of the BS of over regulation, class action lawsuits and government fines. Move your corporate offices offshore and outsource your factories to another nation. That is what they do.

Well it is time to cut costs and save the taxpayers some money so it looks as if we should outsource our government to India. You see all the government produces in excuses and shuffles paper work. It produces stuff like a modern day factory, as our government produces bureaucracy.

Surely in India they can do the same but much cheaper and therefore we can save taxpayers money and reduce the National Debt before the government spends us into oblivion and it is too late. We must Outsource our Government to India and Save Taxpayers Money! Consider this in 2006 and vote for Lance
*************
this write up was on 27th June 2006.
 
#24
What Will the Stock Market Return over the next 10 Years?
in Data Analysis | Investing | Markets
I came across an interesting historical chart of the post '29 market, and posted it last night without comment. It was an accidental Rorschach test -- the permabulls took it as proof that I was (wrongheadly) insisting a depression was imminent, while the more bearish among you saw parallels to the present.

It was neither.

The following charts, however (courtesy of John Mauldin), do have implications. They look at the returns you can expect over the next 5-10 years, based upon valuation metrics:

>
Jeremy Grantham breaks down historic P/E ratios into quintiles,


Note that based upon the histroy of the stock market, we are now in the top 20% of historical valuations. Real returns for the indices when purchased at that price are zero.

Mauldin writes:

"What kind of returns can you expect 10 years after these periods, on average? Interestingly, the first two quintiles, or cheapest periods, have identical returns: 11%. That means when stocks are cheap, you should get 10% over the next 10 years. The last, or most expensive period, sees a return over 10 years of 0%.

This basically squares with data from Professor Robert Shiller of Yale. To ignore it, they must show why "this time it's different." In order for someone to predict, as many do, that stocks will return 6 to 7% over the next 10 years, that person must show that values lie between the second and third quintiles--or that investors will somehow start putting more value on stocks, and thus a floor on the market.

The problem is that the average overrun of the trend in a secular bear market is 50%, which is why stocks get so undervalued. By that, I mean stock market valuations do not stop at the trend. They tend to drop much lower. For the bulls to be right, we would have to see something that has never happened before. Stocks would need to drop to values 25% higher than the long-term historical average and no further.

Which is about where we are today."

Of course, this kind of analysis asks the question as to what "typical" P/E is -- and what it should be:

"What is the average P/E? If you start from 1900, it is 14.8. Starting from 1920 it is 14.4, and starting from 1950 it is 16.8. So, average depends upon when you want to start counting. Using only the last 56 years, we are close to the average P/E. The Grantham chart suggests we should see a return of 8% a year for the next 10 years.

By the way, if you exclude the years 1997-2002, the average P/E ratio drops by more than a full point! Prior to 1997, the average P/E was 13.8."

Now for the histrocial comparo: I have previously made the case that the present market reminds me of the 1972-73 period.

Have a look at this chart by Ed Easterling at Crestmont:


Esterling notes:

"In 1972, P/Es were almost 18, the market was approaching and exceeding new highs, volatility was low, and the market was in the first half of a secular bear market ...what happened next is now history--if it happens again, it won't surprise the old sages..."

Note the bottom thrid of this chart: P/E multiples kept dropping and dropping. That's caused multiple compression (see this chart also), and we are about half way through a similar "classic secular cycle." That makes the present rally "another market high on the way to lower valuations in the future."

I agree with Mauldin, who concludes his 5/5/06 letter with this bon mot:

"Call me a bear, but I continue to believe we are going to get a chance to buy this market at a much lower level than today's close."

Saturday, May 06, 2006 | Permalink
 
#25
George Soros, commenting last week, brought home the point:

"I think we are in a situation where almost all the asset classes will be under pressure or are under pressure and the main reason for that is the reduction in liquidity. What people do not realize is that the Japanese Central Bank has withdrawn something over $200 billion worth of excess liquidity from Japanese banks. Now that money was not put to work in Japan because there was no room for it, a lot of that went abroad, went into emerging markets, there was a so-called carry trade and it is not that suddenly people are risk averse. It is really that liquidity has been drawn out of the market and that is affecting emerging markets."
John Mauldin , an investment adviser says
"
$200 billion in a global economy may not sound like a lot. But remember this was money in fractional reserve banks. They could easily multiply it several times. Pretty soon we could be talking a trillion dollars. Much of it went into providing cheap liquidity to global hedge funds and aggressive investors and banks. Thus, as the leverage went away, these groups started liquidating their very profitable emerging market trades, their commodity trades, and so forth. Everything began to go down at once. Markets that had not been historically correlated all of a sudden went down in tandem to the drumbeats of margin clerks everywhere"
do not think we will be in an actual recession by the end of the year. But a recession is not out of the question for 2007. If the Fed does not have to go too far (and 5.5% may be too far given the other conditions in the world), then we could see a slowdown on the order of what we saw in the mid-90's. We will have to watch the yield curve and other indicators.

In any event, whether it is slowdown or recession, I think investing in the broad stock market is particularly risky. If you are good at picking stocks and know the companies you are investing in, that is one thing. But most readers invest in mutual funds and broadly diversified stock portfolios. Bluntly, I think there is some real risk to the downside.

And if the US economy slows down, so will the housing market and so will the US consumer. That will be a drag on the world economy and world growth in consumption. If the world slows down too much, you could see oil drop back into the $50's or even $40s!
 
#27
hai all sorry to bore you with web extracts.But readthis about USA from a Morgan Stanley adviser Rob Schumacher

My Forecast for the Remainder of 2006:
The economy

Economic growth in the second half of the year settles into a range of 2.5 to 3.5 percent.
Employment levels remain above 94.5 percent of the nation’s labor force but, due to imbedded productivity and global competition, this historically high utilization rate does not generate outsized wage gains.
Total personal income growth cushions interest rate and energy induced stress to consumer spending patterns.
Total corporate profit growth slows; however, it remains at record highs, thereby providing corporate American with funding for continued expansion.
Although already slowing, housing slows less than forecast, which results in a modest contribution from this important sector to overall GDP growth.
Inflationary pressures as measured by the Personal Consumption Expenditure Index ex-food and energy on a year-over-year basis slip under the Federal Open Market Committee’s preferred upper range of 2 percent.
The federal government’s fiscal year deficit declines in percentage terms when compared to the GDP.
Consumer confidence rises.
The stock markets
My year-end target for the S&P 500 Index is, at a minimum, 1348.
Growth stocks outperform value stocks in the second half.
Large-cap stock performance pulls even with—and then surpasses—small cap stock performance by year-end.

Interest rates
The FOMC moves to the sidelines after the June 29 meeting, leaving the federal funds target rate at 5.25 percent for the remainder of the year.
Intermediate-term interest rates drift marginally higher, but end the year at lower levels than at mid-year.
 
#28
hai all
attached is a chart detailing fed interest rates and dow.the co-relation is a figment of imagination as the chart shows.so don't worry if someone says interest rates hikes will affect dow.
ravi
 

Attachments

#29
Hedge funds under scrutiny from senate
All Financial Times News

Hedge funds are to be put under scrutiny by the Senate Judiciary Committee as it hears testimony on their relationships with independent analysts on Wednesday.

The committee willl hear from witnesses including a former Securities and Exchange Commission lawyer, Gary Aguirre, who has accused the agency of blocking his attempts to investigate Pequot, a leading hedge fund, over alleged insider trading.
The hearing is an indication of growing concern in Congress at the impact of the hedge fund industry and the strategies hedge funds use on financial markets.

"This issue has enormous importance to the US economy," Arlen Spector, chairman of the committee, told the hearing at its opening.

Allegations about independent researchers relationships with hedge funds have centred on short sellers. Companies targeted by short sellers often complain that their share prices are pushed down by aggressive shorting.

The hearing is the latest evidence of uneasy relations between hedge funds and regulators and lawmakers.
 
#30
The ugly outlook for big tech - by Jon Markman

Why technology looks tapped

So far, it looks as though technology companies are in line to suffer disproportionately in the transition to a less expansive second-half outlook, while energy and basic materials companies' forecasts will provide a strong counterbalance. Of course results will vary widely, but even the companies with the strongest fundamental stories are likely to struggle as investors exhibit their lack of confidence in the future by allowing price-to-earnings multiples to shrink to two-decade lows.

How deep have expectations already sunk? According to Thomson Financial data, analysts have slashed technology companies' outlook by a third in the past three months, which is a ton. On April 1, second-quarter earnings growth was expected to come in at 15% year over year; now growth is expected to come in at 10%.

The skid is largely a result of remarkably poor execution at increasingly complex large technology companies: Of the 72 tech companies in the S&P 500 ($INX), 39 have had their estimates cut since April 1. The trend is ugliest for the old warhorses, as Microsoft (MSFT, news, msgs), Intel (INTC, news, msgs) and Dell (DELL, news, msgs) amount to two-thirds of the total of estimate reductions. Consensus estimates on Intel have fallen to 14 cents a share from 22 cents since April 1, while Microsoft estimates are down to 30 cents a share from 34 cents and Dell is down to 32 cents a share from 39 cents. (Editor's note: Microsoft is the publisher of MSN Money.)

One of the most reliable indicators of future price performance over the 2003-2005 bull market was rising earnings estimate revisions, so this trend of negative revisions at big-cap tech, which has been going on for awhile, is quite worrisome and shows no signs of reversing. Negative estimate revisions tend to snowball, as analysts never seem to cut enough at any given time, so they have to keep cutting.

Moreover, historically, investors themselves are slow to react to downward revisions. A few relevant examples: Intel guided its second-quarter down on April 19, complaining of high inventory levels at companies, but the stock didn't really start to crack hard until May. Microsoft guided down on April 27 and has seen shares fall 17% since; and Dell guided down on May 8 and shares have fallen 10% since.

Hai all

NOTE : The above report is for US companies and may not be true for Indian Companies.But it is bound to Spill over as International mutual funds may strat to offload technology as a whole sector from their focus

bye
ravi
 

Similar threads